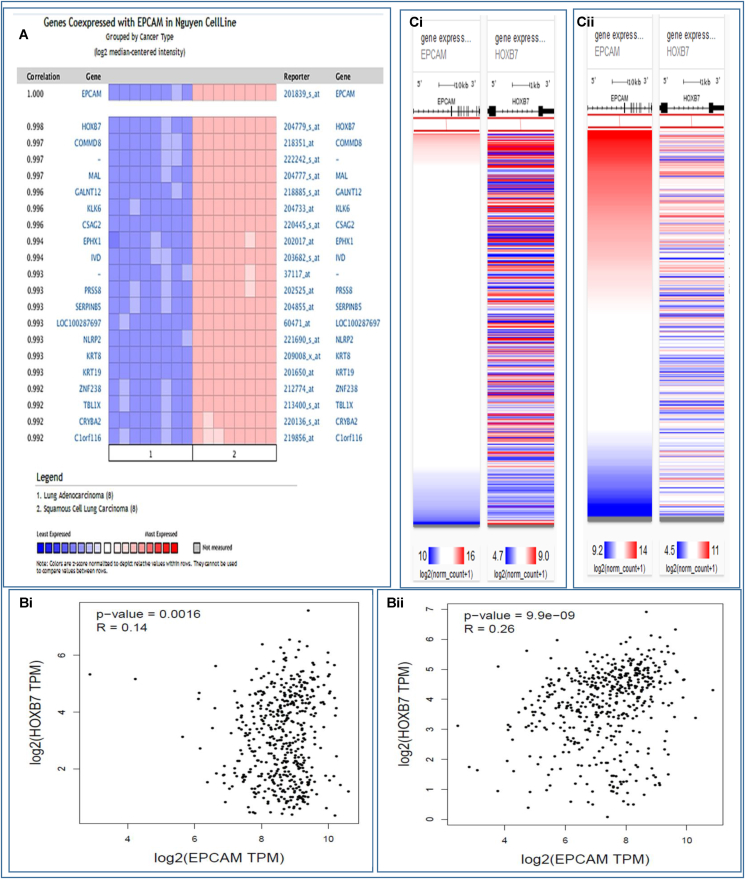
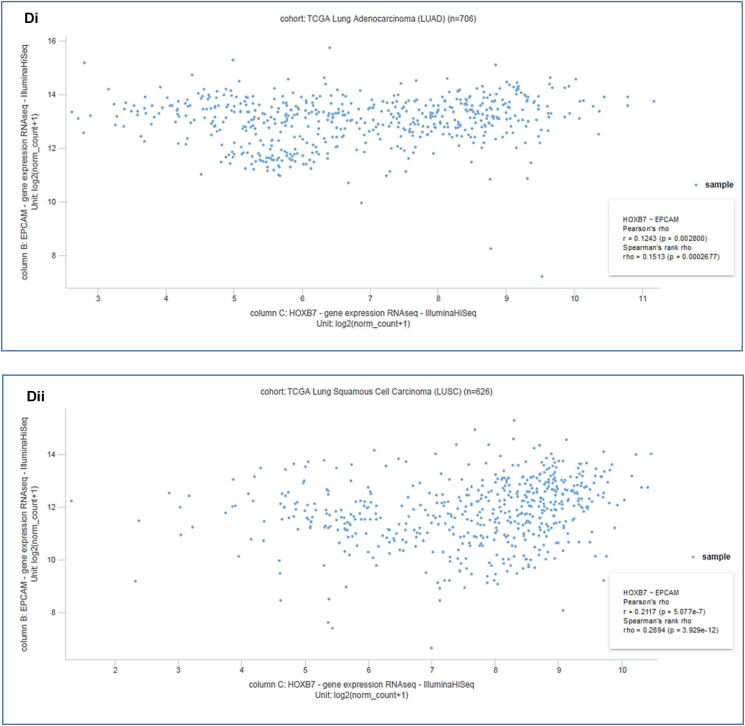
Fig. 7.
Co-expression profile of the EpCAM and co-expressed genes in human LC. The figure shows (A) co-expression profile of EpCAM derived from the Oncomine database, (B) correlation analysis between EpCAM and HOXB7 obtained by GEPIA2 server, (C) heatmap of mRNA expression for EpCAM and HOXB7 genes across LC in the TCGA database, and (D) co-expression analysis between EpCAM and HOXB7 genes in LC using UCSC Xena server.


