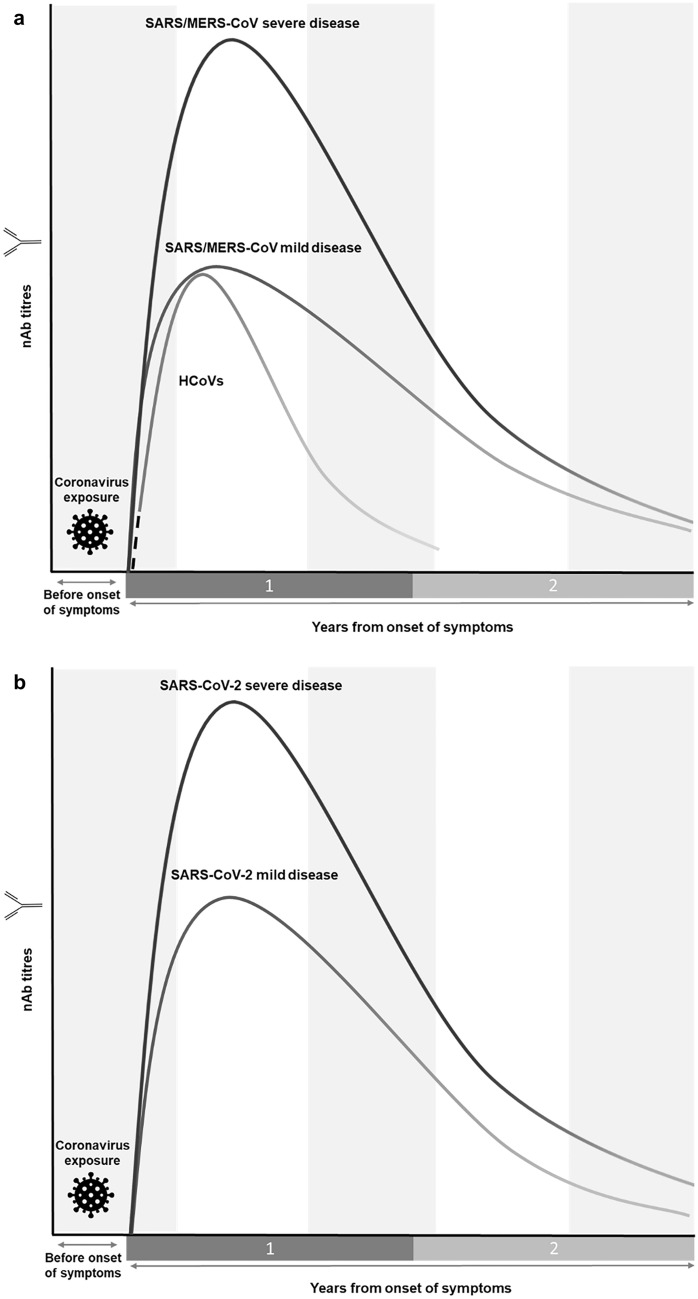
Fig. 1.
Graphical representation of the longevity and magnitude of the nAb antibody response to coronaviruses. a Shows trends in antibody kinetics to SARS-CoV, MERS-CoV and HCoVs, highlighting the relatively rapid waning of HCoV nAbs as well as higher titres generated in severe SARS-CoV/MERS-CoV infection [28–32, 34–38, 40–42, 44, 52]. The dotted line indicates a lack of serological data for common cold coronavirus infections in individuals naïve to the infection. b Compares antibody titre trends in severe and mild SARS-CoV-2 and their waning over time, highlighting the higher titres generated in severe infection [56–58, 60, 62–64]. Neither graph drawn to scale. SARS-CoV severe acute respiratory syndrome coronavirus, MERS-CoV Middle East respiratory syndrome coronavirus, HCoV human coronavirus

