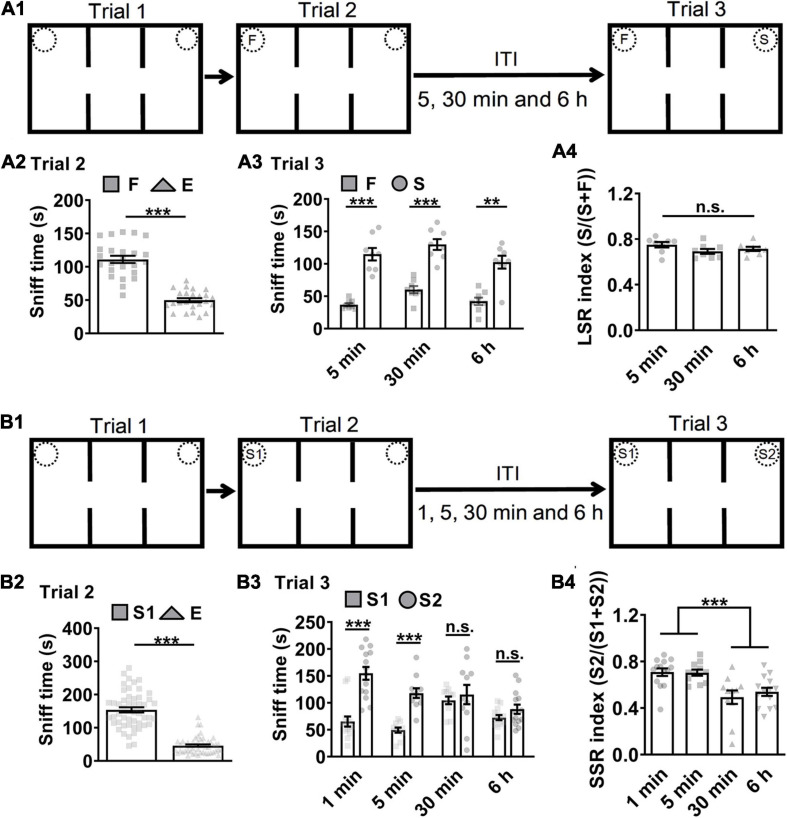
FIGURE 1.
Mice short-term memory monitored in social recognition test. (A1) Schematic of experimental paradigm. ITI, inter-trial intervals; F, a familiar littermate of the subject mice. S, a stranger mouse. (A2) Subject mice exhibited preference (more sniff time) to F than E, suggesting normal sociability in trial 2 by F vs. E (n = 24; t = 11.770, ***P < 0.0001). (A3) Subject mice showed preference to S than F in trial 3 (n = 8 for ITI 5 min, t = 7.832, P < 0.0001; n = 8 for ITI 30 min, t = 7.002, P < 0.0001; n = 8 for ITI 6 h, Wilcoxon test, P = 0.0078). (A4) Subject mice showed higher LSR index to S than F in trial 3 by F vs. S regardless of the ITIs (n = 8 for 5 min; n = 8 for 30 min; n = 8 for 6 h; F(2,21) = 1.903, P = 0.1739), suggesting that long-term memory for F can guide social recognition. (B1) Schematic of experimental paradigm. S1, a first stranger mouse; S2, a second stranger mouse; E, empty cage. (B2) Subject mice exhibited preference to S1 over E, suggesting normal sociability in trial 2 by S1 vs. E (n = 50; Wilcoxon test, P < 0.0001). (B3) Subject mice showed preference to S2 over S1 under the ITIs for 1 or 5 min but not for 30 min or 6 h (n = 14 for 1 min, Wilcoxon test, P = 0.0006; n = 11 for 5 min, t = 6.699, P < 0.0001; n = 11 for 30 min, t = 0.5549, P = 0.5851; n = 14 for 6 h, t = 1.574, P = 0.2388). (B4) Subject mice showed higher SSR index to S2 over S1 under the ITIs for 1 or 5 min but not for 30 min or 6 h, suggesting that normal social recognition in trial 3 by S1 vs. S2 was limited by social short-term memory for experienced S1 under 30 min (n = 14 for 1 min; n = 11 for 5 min; n = 11 for 30 min; n = 14 for 6 h; P = 0.0002, χ2 = 20.13. Dunn’s multiple comparisons test, 1 min vs. 5min, P > 0.9999; 1 min vs. 30 min, P = 0.0042;1 min vs. 6h, P = 0.0054; 5 min vs. 30 min, P = 0.0163; 5 min vs. 6h, P = 0.0228; 30 min vs.6h, P > 0.9999.). ***P < 0.001; n.s., not significant. Data presented as mean ± SEM. Statistical analysis was performed by using Wilcoxon test, Kruskal–Wallis test followed by Dunn’s post hoc analysis, student’s t test or one-way ANOVA followed by Tukey’s post hoc analysis.

