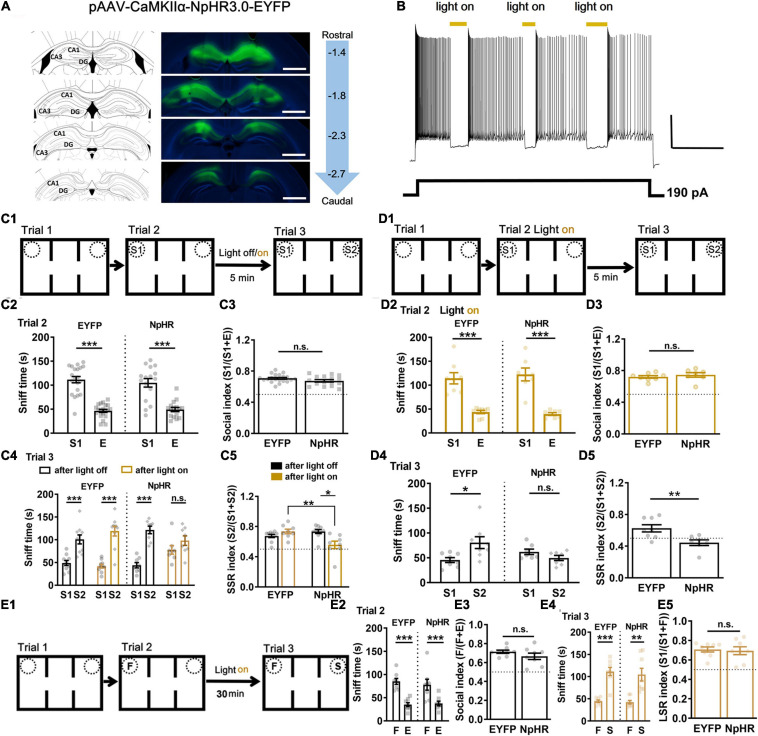
FIGURE 2.
Short-term but not long-term social memory-guided recognition disrupted by optogenetic silencing of CA1 neuronal activity. (A) Expression of pAAV-CaMKII-NpHR3.0-EYFP and pAAV-CaMKII-EYFP was checked in CA1 regions of the dorsal hippocampus at 3 weeks after the virus injection. Left: injection site according to the mouse brain atlas. Right: viral expression in CA1 regions, and distance (in mm) from bregma on the sagittal suture. Calibration bars, 1 mm. (B) Action potentials elicited by current injection were inhibited by light on (yellow, 594 nm) in NpHR3.0 expressed CA1 neurons in vitro. Calibration bar, horizontal 10 s, vertical 20 mV. (C1) Schematic of experimental paradigm for SSR. Light was given during ITI 5 min. (C2) All the mice showed normal sociability in trial 2 by exploring S1 vs. E (n = 20 for EYFP, t = 8.8717, P < 0.0001; n = 16 for NpHR, t = 5.56007, P < 0.0001). (C3) All groups showed normal sociability with regards to social index in trial 2 (n = 20 for EYFP, n = 16 for NpHR, t = 1.696, P = 0.0990). (C4) Light on during the 5-min ITI impaired subsequent social recognition in trial 3 by exploring S1 vs. S2 in NpHR group but not in EYFP group, while light off had no significant effect on both the groups (n = 10 for EYFP with light off, t = 4.56881, P = 0.000476; n = 10 for EYFP with light on, t = 6.69973, P < 0.0001; n = 8 for NpHR with light off, t = 7.6989, P < 0.0001; n = 8 for NpHR with light on, Wilcoxon test, P = 0.1953). (C5) NpHR with light on group showed lower SSR index in contrast to EYFP with light group or to NpHR with light off group (n = 10 for EYFP, n = 8 for NpHR; P = 0.0027, χ2 = 14.18. Dunn’s multiple comparisons test, EYFP on vs. NpHR on, P = 0.0036; NpHR off vs. NpHR on, P = 0.0245; ***P < 0.001). n.s., not significant. (D1) Schematic of experimental paradigm for SSR. Light was given during trial 2. (D2) All the mice showed normal sociability in trial 2 by exploring S1 vs. E (n = 8 for EYFP, t = 5.7557, P < 0.0001; n = 7 for NpHR, t = 5.9880, P < 0.0001). (D3) Light on during trial 2 by exploring S1 vs. E had no significant effects on sociability in terms of social index (n = 8 for EYFP, n = 7 for NpHR, t = 0.7935, P = 0.4417). (D4) Light on during trial 2 still impaired social recognition in trial 3 by exploring S1 vs. S2 in NpHR but not EYPF control (n = 8 for EYFP, Wilcoxon test, P = 0.0391; n = 7 for NpHR, t = 1.6203, P = 0.1311; *P < 0.05). (D5) NpHR with light on group showed lower SSR index in contrast to EYFP with light group (n = 8 for EYFP, n = 7 for NpHR, t = 3.076, P = 0.0089; **P < 0.01). (E1) Schematic of experimental paradigm for LSR. (E2) All the mice showed normal sociability in trial 2 by exploring F vs. E (n = 8 for EYFP, t = 4.7343, P = 0.000115; n = 8 for NpHR, t = 3.8325, P = 0.000657; ***P < 0.001). (E3) EYFP and NpHR groups showed similar sociability with regards to social index in trial 2 (n = 8 for EYFP, n = 8 for NpHR, t = 1.269, P = 0.2252). (E4) Light on during the 30-min ITI did not affect social recognition in trial 3 by exploring F vs. S in NpHR group (n = 8 for EYFP, t = 6.965, P = 0.000437; n = 8 for NpHR, t = 3.688, P = 0.007781; **P < 0.01; ***P < 0.001). (E5) NpHR with light on group showed similar LSR index as EYFP group (n = 8 for EYFP, n = 8 for NpHR, t = 0.2723, P = 0.7894). S1, a first stranger mouse; E, empty cage; S2, a second stranger mouse; F, a familiar littermate of the subject mice. Data presented as mean ± SEM. Statistical analysis was performed by using Wilcoxon test, Kruskal–Wallis test followed by Dunn’s post hoc analysis, student’s t test or two-way ANOVA followed by Sidak’s post hoc analysis.

