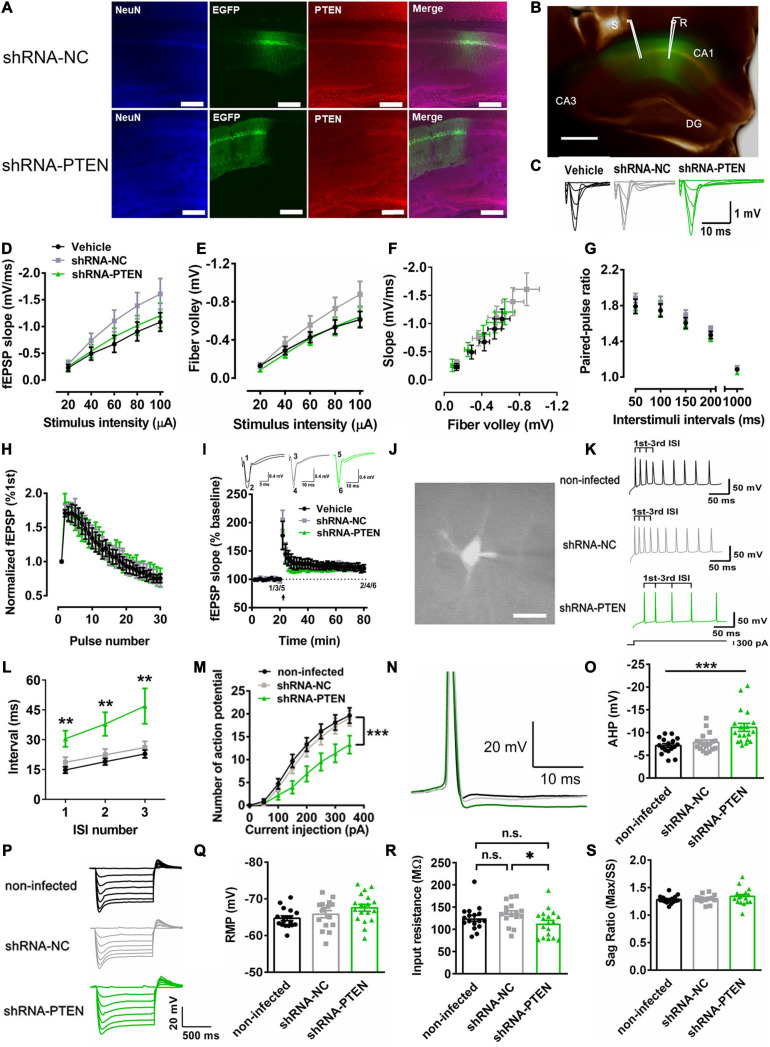
FIGURE 3.
Reduced firing rate in vitro with CA1 PTEN knock down (KD). (A) Immunofluorescence staining of NeuN and PTEN on lentivirus-infected dorsal CA1 cells labeled with EGFP. In LV-shRNA-PTEN-GFP group, cells labeled with EGFP were not labeled with anti-PTEN antibody. Calibration bar, 150 μm. (B) Merged bright-field with EGFP fluorescence image showed representative fEPSP recording in virus-affected CA1 region of the dorsal hippocampus by stimulating the Schaffer collaterals in brain slices. Calibration bar, 500 μm. (C) Traces for fEPSP recordings of input-output curve. (D) The input-output curve plotted with stimulus intensity against slope was not significant difference among the groups (n = 8 from 3 mice for Vehicle, n = 7 from 3 mice for the other two groups; Two-way ANOVA with Sidak’s post hoc test. Factor of stimulus intensity x treatment, F(8,76) = 1.956, P = 0.0636; Factor of stimulus, F(4,76) = 99.92, P < 0.0001; Factor of treatment, F(2, 19) = 1.338, P = 0.2860; P > 0.05). (E) The input-output curve plotted with stimulus intensity against fiber volley was not significant difference among the groups (n = 8 from 3 mice for Vehicle, n = 7 from 3 mice for the other two groups; Two-way ANOVA with Sidak’s post hoc test. Factor of stimulus intensity x treatment, F(8, 76) = 1.994, P = 0.0584; Factor of stimulus, F(4, 76) = 124.0, P < 0.0001; Factor of treatment, F(2, 19) = 1.326, P = 0.2890; P > 0.05). (F) The input-output curve plotted with slope against fiber volley. (G) A form of short-term synaptic plasticity, the paired-pulse facilitation, was not significant different among the groups (n = 8 from 3 mice for Vehicle, n = 7 from 3 mice for the other two groups, P > 0.05). (H) Another form of short-term synaptic plasticity, the short-term augmentation at 20 Hz, was also not significant different among the groups (n = 8 from 3 mice for Vehicle, n = 7 from 3 mice for the other two groups, P > 0.05). (I) Long-term potentiation was not significant different among the groups (n = 6 from 3 mice for Vehicle, n = 7 from 3 mice for the other two groups, P > 0.05). (J) Whole-cell recordings via the fluorescence of CA1 neurons. Calibration bar, 20 μm. (K) Examples of voltage trace elicited by a constant current injection for 1 s at 300 pA. (L) The first three inter-spike intervals (ISIs) were monitored. The shRNA-PTEN group showed higher ISI in contrast to non-infected and shRNA-NC groups (n = 17 for non-infected from 5 mice, n = 18 for shRNA-NC from 4 mice, n = 18 for shRNA-PTEN from 6 mice; 1st, P = 0.0037. χ2 = 11.18. 1st Vehicle vs. 1st shRNA-NC, P = 0.9594; 1st Vehicle vs. 1st shRNA-PTEN,P = 0.0035; 1st shRNA-NC vs. 1st shRNA-PTEN, P = 0.0664; 2nd, P = 0.0061. χ2 = 10.20. 2nd Vehicle vs. 2nd shRNA-NC, P > 0.9999; 2nd Vehicle vs. 2nd shRNA-PTEN,P = 0.0081; 2nd shRNA-NC vs. 2nd shRNA-PTEN, P = 0.0448; 3rd, P = 0.0059. χ2 = 10.26. 3rd Vehicle vs. 3rd shRNA-NC, P > 0.9999; 3rd Vehicle vs. 3rd shRNA-PTEN,P = 0.0096; 3rd shRNA-NC vs. 3rd shRNA-PTEN, P = 0.0326). (M) The firing rate of the evoked action potentials was significantly reduced in shRNA-PTEN neurons compared with NC or non-infected neurons (n = 17 for non-infected from 5 mice, n = 18 for shRNA-NC from 4 mice, n = 18 for shRNA-PTEN from 6 mice; ∗∗∗P < 0.001). (N) Sample traces of after-hyperpolarization (AHP) of action potentials elicited by a constant current injection for 1 s at 300 pA. (O) Increased AHP at 25 ms after the action potential onset in shRNA-PTEN neurons compared with NC and non-infected neurons (n = 17 for non-infected from 5 mice, n = 18 for shRNA-NC from 4 mice, n = 18 for shRNA-PTEN from 6 mice; P = 0.0002. χ2 = 17.59. non-infected vs. shRNA-NC, P > 0.9999; non-infected vs. shRNA-PTEN,P = 0.0004; shRNA-NC vs. shRNA-PTEN, P = 0.0027). (P) Representative response of voltage steps by injecting hyperpolarization current from resting membrane potential. (Q) No significant difference in resting membrane potential (RMP) among the groups (n = 18 for shRNA-PTEN from 6 mice, n = 17 for non-infected from 5 mice, n = 16 for shRNA-NC from 4 mice, P > 0.05). (R) Input resistance was significantly different among the groups (n = 18 for shRNA-PTEN from 6 mice, n = 17 for non-infected from 5 mice, n = 16 for shRNA-NC from 4 mice; P = 0.0368, χ2 = 6.602. Dunn’s multiple comparisons test, non-infected vs. shRNA-NC, P = 0.4762; non-infected vs. shRNA-PTEN, P = 0.7410; shRNA-NC vs. shRNA-PTEN, P = 0.0307). (S) No sag ratio difference among the groups (n = 18 for shRNA-PTEN from 6 mice, n = 17 for non-infected from 5 mice, n = 16 for shRNA-NC from 4 mice, F(2, 48) = 1.392, P = 0.2585). Data presented as mean ± SEM. Statistical analysis was performed by using Kruskal–Wallis test followed by Dunn’s post hoc analysis and two-way or one-way ANOVA followed by Tukey’s post hoc analysis.

