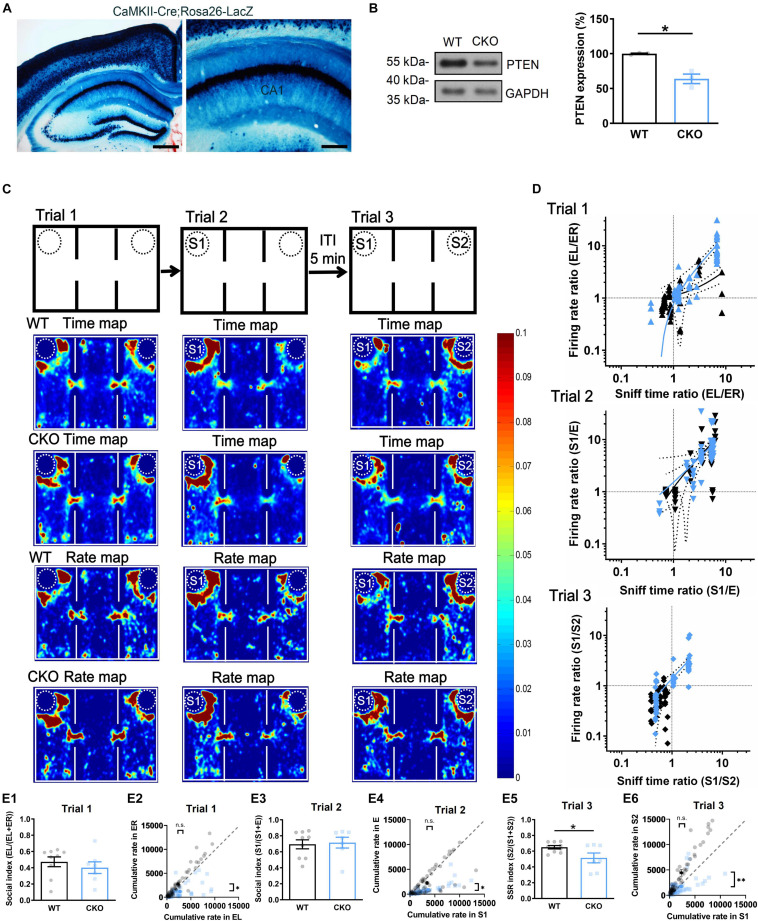
FIGURE 5.
Altered CA1 neuronal firing pattern during social recognition in conditional forebrain PTEN knockout (CKO) mice. (A) X-Gal staining of Cre activity in CaMKII-Cre;Rosa26-LacZ mouse. Calibration bars: Left, 500 μm; Right, 200 μm. (B) Western blot of the dorsal CA1 samples from PTEN CKO mice showed down-regulation of PTEN expression relative to WT mice (n = 3/group; *P < 0.05). (C) Wild type (WT) and PTEN CKO mice were examined in three-chambers and three-trials social interaction test during which activity of CA1 neurons were recorded by using a multiple single-unit recording system and behavioral tracks of the mice were recorded by using a video system. Time map showing where subject mice spend their time; Rate map displaying where CA1 neuron is firing at a rate. Warmer colors represent more time or higher firing rate during 10-min per trial. Accumulated data (60 neurons from 9 WT; 59 neurons from 7 CKO) suggested a highly association between time map and rate map, but no difference between PTEN CKO and WT mice in trial 1 and 2. However, these maps showed a marked preference to S2 over S1 in WT mice but not in PTEN CKO mice in trial 3. (D) Empty cage in left side (EL)/empty cage in right side (ER) or a first stranger (S1)/empty cage (E) in the other side or a first stranger (S1)/a second stranger (S2) were used to calculate sniff time ratio or firing rate ratio, which were further plotted against each other. The distribution of the quantification dots in trial 1 and trial 2 was hardly separated for PTEN CKO (blue) from WT mice (black). Linear regression in Trial 2, Y = 1.645*X - 0.4547 for WT, Y = 1.393*X + 0.1245 for CKO, P = 0.6131 for slope comparison, P = 0.7253 for elevation comparison; Linear regression in Trial 3, Y = 0.7190*X + 0.1566 for WT, Y = 1.549*X - 0.1612 for CKO, P = 0.4197 for slope comparison, P = 0.4508 for elevation comparison. However, the quantification dots were clearly separated as two clusters in PTEN CKO that indicated no preference to S2 over S1, but those were kept in one cluster in WT mice that indicated preference to S2 over S1. (E1) Social index was similar between WT and PTEN CKO in trial 1 (n = 9 for WT, n = 7 for CKO, t = 0.7669, P = 0.4559). (E2) Cumulative rate was similar between WT EL and CKO EL in trial 1. Cumulative rate was higher in WT ER relative to CKO ER (n = 60 single units for WT, n = 59 single units for CKO; WT EL vs. CKO EL, P = 0.4191; WT ER vs. CKO ER, P = 0.0185). (E3) Social index was similar between WT and PTEN CKO in trial 2 (n = 9 for WT, n = 7 for CKO, Mann Whitney’s U test, P > 0.9999). (E4) Cumulative rate was similar between WT S1 and CKO S1 in trial 2. Cumulative rate was higher in WT E relative to CKO E (n = 60 single units for WT, n = 59 single units for CKO, WT S1 vs. CKO S1, P = 0.5675; WT E vs. CKO E, P = 0.0106). (E5) SSR index was significantly different between WT and PTEN CKO in trial 3 (n = 9 for WT, n = 7 for CKO, t = 2.258, P = 0.0405). (E6) Cumulative rate was similar between WT S1 and CKO S1 in trial 3. Cumulative rate was higher in WT S2 relative to CKO S2 (n = 60 single units for WT, n = 59 single units for CKO, WT S1 vs. CKO S1, P = 0.7018; WT S2 vs. CKO S2, P = 0.003; **P < 0.01, *P < 0.05). EL, empty cage left; ER, empty cage right; E, empty cage; S1, the first stranger mouse; S2, the second stranger mouse. Data presented as mean ± SEM. Statistical analysis was performed by using Mann Whitney’s U test, Kolmogorov–Smirnov test and student’s t test.

