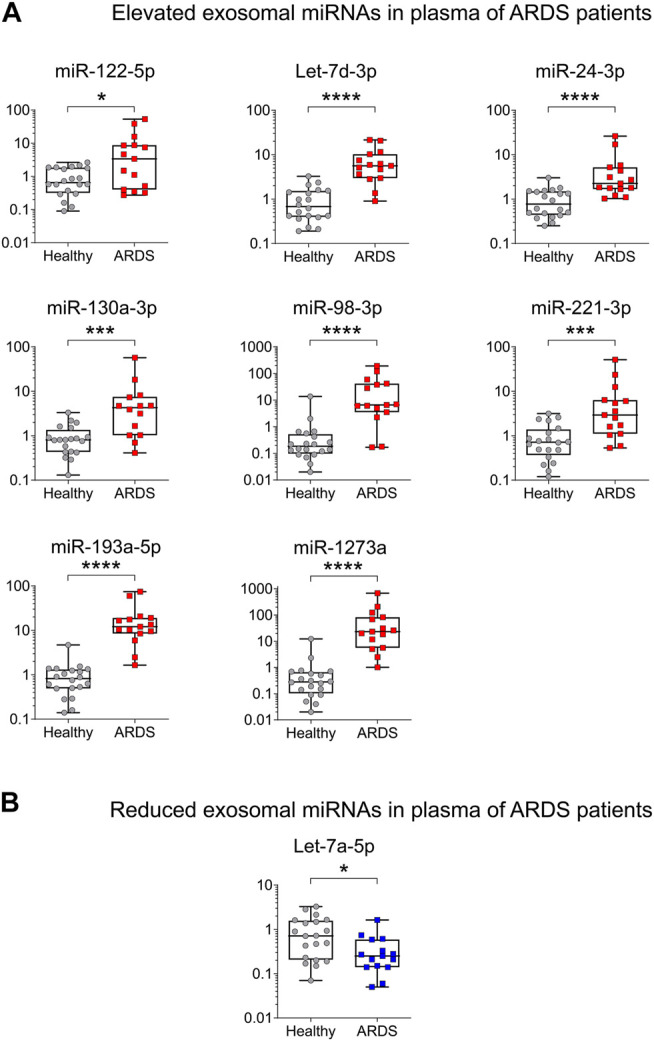
FIGURE 3.

Validation of ARDS-related miRNAs in an independent cohort by qRT-PCR. (A) High levels of plasma exosomal miRNAs in ARDS. miR-122-5p Fold change (FC) = 5.17, Let-7d-3p FC = 8.22, miR-24-3p FC = 2.92, miR-130a-3p FC = 5.28, miR- 98-3p FC = 5.28, miR-221-3p FC = 4.10, miR-193a-5p FC = 14.79 and miR-1273a FC = 83.17. (B) Low levels of plasma exosomal miRNAs in ARDS. Let-7a-5p FC = −2.74. Data are non-normally distributed and analyzed using a non-parametric two-tailed Mann–Whitney test: *p < 0.05, **p < 0.01, ***p < 0.001, and ****p < 0.0001. HS (gray circles) n = 20 biologically independent samples; ARDS (red squares) n = 15 biologically independent samples.
