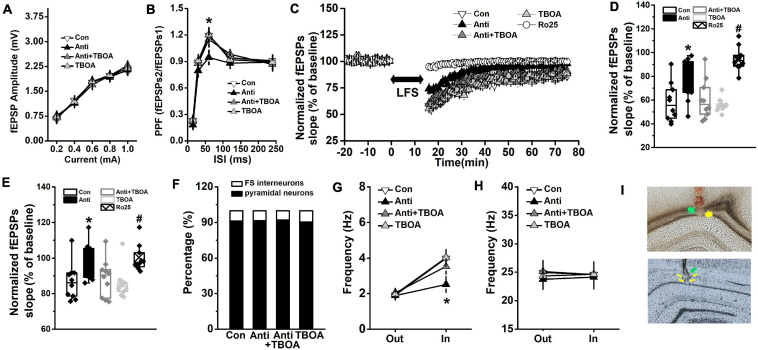
FIGURE 5.
GluN2B-dependent neural function is enhanced by TBOA. The Anti group was bilaterally infused with anti-proBDNF antibody into the CA1 region throughout the whole PD4w, whereas the Con group received the same volume of ACSF. Eight-week-old rats were selected for detecting hippocampal synaptic function in the Schaffer collateral-CA1 pathway immediately following TBOA (Anti+TBOA and TBOA groups), Ro25 (Ro25 group), or ACSF (Con and Anti groups) injection. (A) Input–output curves of fEPSP slopes. (B) PPF, a form of short-term plasticity, was measured and expressed as the ratio of fEPSPs2 to fEPSPs1. (*p < 0.05, Anti vs. other groups). (C) Characteristic time courses of fEPSP slope. Arrow represented application of LFS. (D) The effects on PTD, which was determined as response 1 min after LFS. (*p < 0.05, Anti vs. other groups; #p < 0.05, Ro25 vs. other groups) (E) Time coursing changes in fEPSPs slope. Magnitude of SL-LTD was determined as responses in the last 20 min (between 56 and 75 min). (*p < 0.05, Anti vs. other groups; #p < 0.05, Ro25 vs. other groups). n = 10 per group. When rats were tested in the probe trial that was conducted 24 h following the last training trial, neural activity around the target platform area was recorded. TBOA (Anti+TBOA and TBOA groups) or ACSF (Con and Anti groups) infusion was conducted 30 min prior to the behavioral test. (F) The proportion of pyramidal neuron and FS interneuron. (G) Firing rate of pyramidal neurons out of target area (Out) and around the targeted platform (In) during the probe test. (H) Firing rate of FS interneuron out of target area (Out) and around the targeted platform (In) during the probe test. (*p < 0.05, Anti vs. other groups). n = 10 per group. (I) The histological representations of the recording sites during the fEPSPs (top) and neuronal activity (bottom) experiments. The green and yellow arrows indicate infusion site and recording site, respectively.

