
Figure 6.
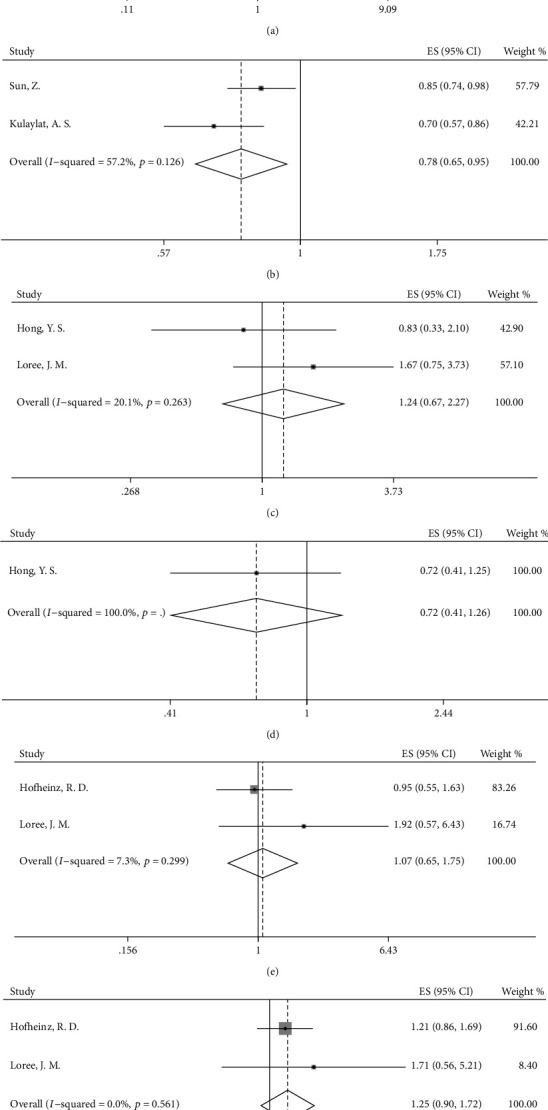
Forest plot based on overall survival and tumor stage. (a) OS in chemotherapy group versus observation group in patients with ypStage II; (b) OS in chemotherapy group versus observation group in patients with ypStage III; (c) OS in OX/FU-based group versus FU-based group in patients with ypStage II; (d) OS in OX/FU-based group versus FU-based group in patients with ypStage III; (e) OS in OX/FU-based group versus FU-based group in patients with clinical stage II; (f) OS in OX/FU-based group versus FU-based group in patients with clinical stage III.