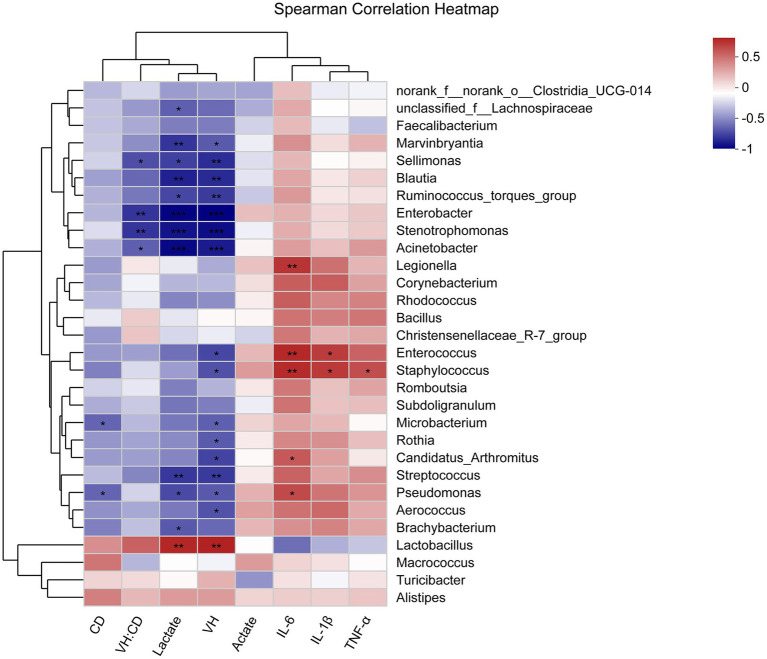
Figure 7.
Heatmap of spearman’s correlation between ileal microbiota, metabolites, morphology, and immune factors. The correlation was analyzed based on the relative abundance of 30 phylotypes at genus level. The blue suggests a negative correlation, and the red suggests a positive correlation. The “*” indicates 0.01< p ≤ 0.05, “**” indicates 0.001< p ≤ 0.01, and “***” indicates p ≤ 0.001.

