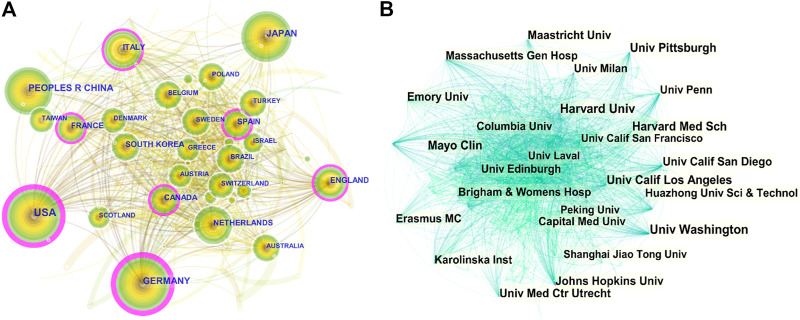
FIGURE 2.
CiteSpace visualization map of countries and institutions involved in vascular calcification research. (A) Collaboration network of countries. N = 104, E = 798. N represents the number of network nodes. E represents the number of connections. (B) Collaboration network of institutions. N = 480, E = 3,382.

