Fig. 1.

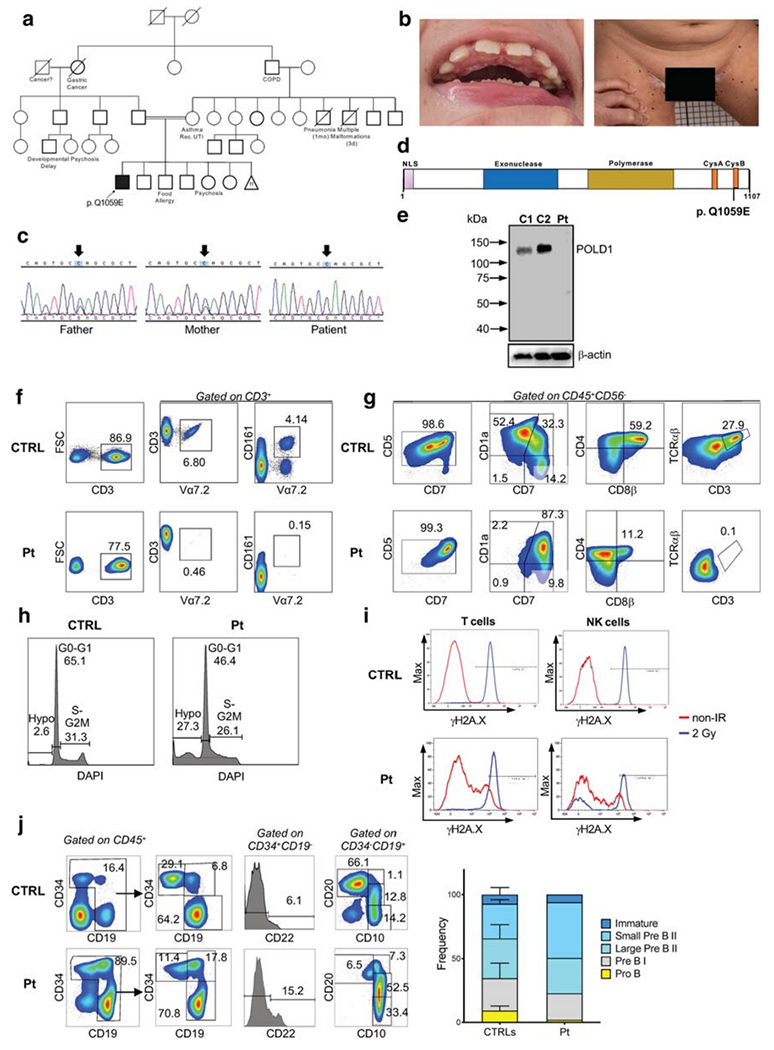
Genetic, biochemical, and functional studies in a patient with POLD1 deficiency. (A) Family pedigree. COPD, chronic obstructive pulmonary disease; Rec. UTI, recurrent urinary tract infections. Mother had 11 miscarriages. (B) Dental abnormalities and multiple black, flat nevi on the patient’s inner thigh surface. (C) Sanger sequencing confirmation of the POLD1 variant. Arrows designate the mutated nucleotide. (D) Domain structure of POLD1 showing the nuclear localization signal (NLS), the exonuclease domain, the polymerase domain, the cysteine-rich, metal-binding domains CysA and CysB, and location of the Q1059E mutation site. (E) Immunoblotting of POLD1 and β-actin protein expression in peripheral blood mononuclear cell lysates from the patient (Pt) and two healthy controls (C1, C2). (F) Representative FACS plot from a healthy control (CTRL) and patient (P), showing the frequency of Vα7.2 and MAIT (Vα7.2+CD161+) cells upon gating on CD3+ cells. (G) In vitro T cell differentiation of bone marrow–derived CD34+ CD3− cells from a healthy control (CTRL) and the patient (Pt) after 6 weeks of culture in an artificial thymic organoid (ATO) system. FACS plots show expression of early and late T cell differentiation markers CD7, CD5, CD1a, CD4, CD8β, TCRαβ, and CD3 upon gating on LIVE/DEAD− CD45+ CD56− cells. (H) The histograms show the distribution of cells in the different phases of cell cycle after cell staining for DNA content (DAPI) in a healthy control (CTRL) and in the patient (Pt), upon gating on total CD45+ CD56− cells during differentiation in the ATO system. (I) Flow cytometric analysis showing γH2AX expression in unirradiated conditions and at 1-h post irradiation (2Gy) in rested PBMCs from a healthy control (CTRL) and the patient (Pt). Gating was done on CD3+ T cells (left panels) and on CD56/CD16+ CD3− NK cells (right panels) (J) Flow cytometric analysis of the distribution of cells at various stages of B cell differentiation in the bone marrow aspirate from a healthy control (CTRL) and the patient (Pt). Upon gating on CD45+ cells, pro-B cells were identified as CD34+ CD19− CD22+, and pre-BI cells were identified as CD34+ CD19+ cells. Expression of CD10 and CD20 upon gating on CD45+ CD34− CD19+ cells identifies small pre-BII (CD10+ CD20), Urge pre-BII (CD10+ CD20dim), and immature (CD 10+ CD20+) B cells. (L) Bar graphs show cumulative frequency of B cell developmental stages in 3 healthy controls (CTRLs) and in the patient (Pt). Bars identify standard deviation
