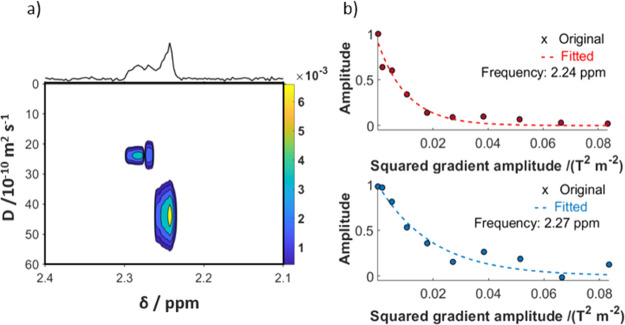
Figure 2.
DOSY analysis of mSBF. (a) Mapped diffusion coefficients in dependence of the chemical shift. When both the Pi and the PPNS signals, appear well-separated in the 31P NMR spectra, DOSY of the system allows one to discern two phosphate species via their diffusion coefficients. A slower diffusion coefficient is observed for the species underlying PPNS (left) compared to the signal underlying Pi (right). The diffusion coefficients were ∼24 × 10–10 vs ∼43 × 10–10 m2 s–1, respectively. The data were acquired at 37 °C for 5 h at a phosphate concentration of 5 mM. (b) Monoexponential fits of the two DOSY profiles underlying the data in panel (a). The PPNS signal decays slower with increasing gradient amplitude than the Pi signal.

