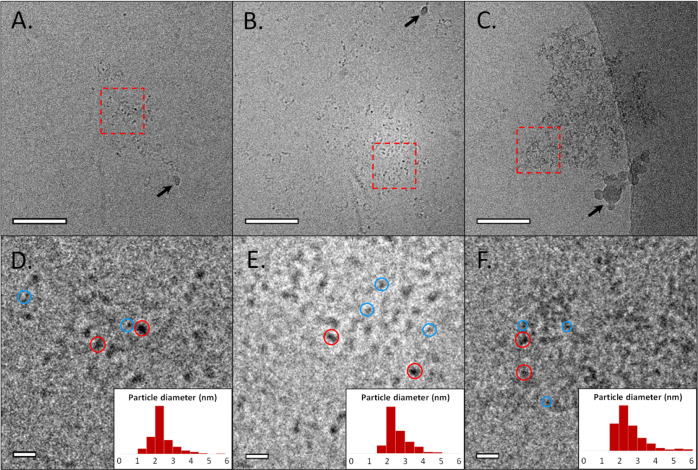
Figure 4.
Cryo-TEM observations of mSBF solution at different time points—(A) 1 h, (B) 5.5 h, and (C) 23 h after mSBF preparation, respectively. (D–F) Zoom of the corresponding zones delimited by the red squares in (A–C). Insert displays size evaluation of individual PNS. Blue and red circles give an example of smaller and bigger PNS, respectively. The black arrows indicate the presence of polluting agents, due to the freezing process. Scale bar (A–C) = 50 nm. Scale bar (D–F) = 10 nm.

