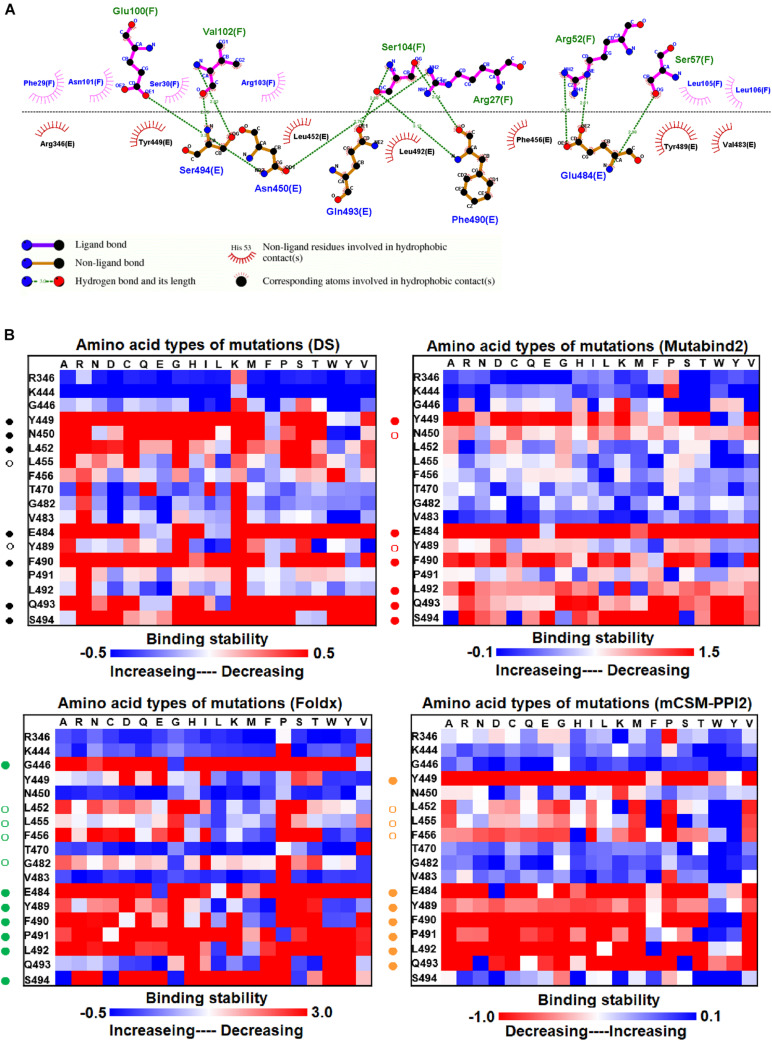
FIGURE 2.
The mutational binding stabilities of RBD variants interacting to H11-D4 nanobody. (A) The molecular interactions of SARS-CoV-2 RBD with H11-D4 nanobody analyzed by ligplot. The chains E and F correspond to RBD and H11-D4 nanobody, respectively. (B) The heatmap of interactive residues of RBD derived from the calculated mutational binding stabilities by using Discovery Studio 3.5 (DS), Mutabind2, FoldX, and mCSM-PPI2. The boxes of each mutations were colored with the gradient of a range between blue (stabilized binding) and red (destabilized binding). In all panels, the solid and hollow circles denote significant and moderate decreases of the binding stabilities, respectively.

