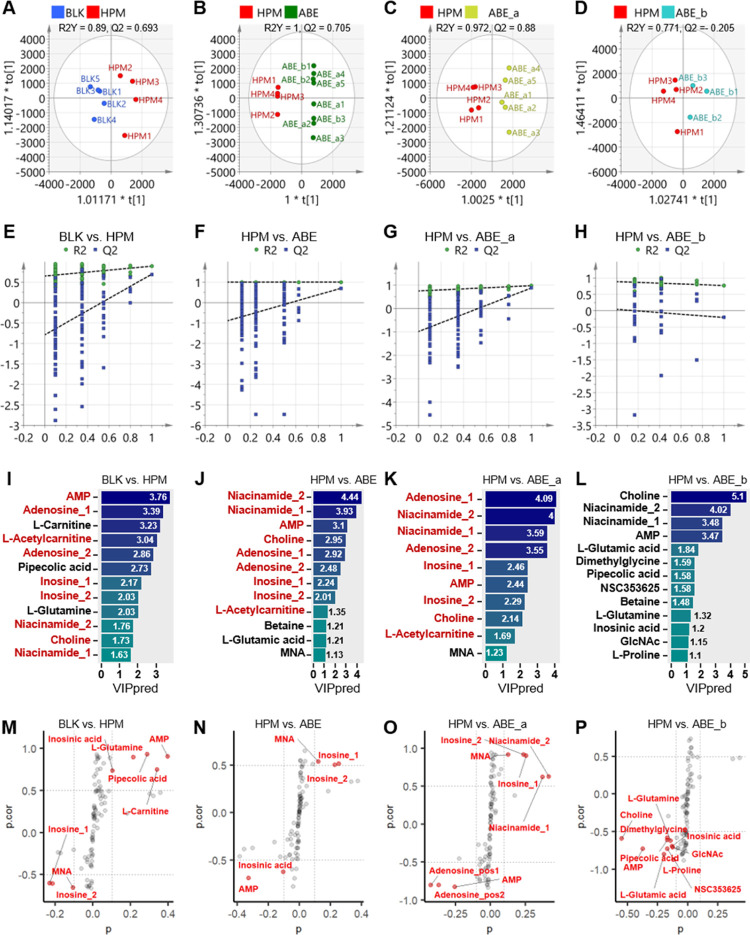
Figure 2.
Effect of different dosages of ABE on the metabolomic profile of heart tissue from rats. (A–D) OPLS-DA model discriminating the metabolic profiles of rats. (E–H) 200-permutation test of different groups. (I–L) VIP scores of OPLS-DA analysis. (M–P) S-plot obtained from the OPLS-DA model, variables selected (|p| > 0.1 & |p.cor| > 0.5) are highlighted in red. BLK, blank; HPM, hypertension model; ABE_a, 25 mg/kg/d ABE; ABE_b, 50 mg/kg/d ABE; AMP, Adenosine monophosphate; MNA, 1-Methylnicotinamide; NSC353625, N-α-acetyllysine; GIcNAc, N-acetylglutamine.

