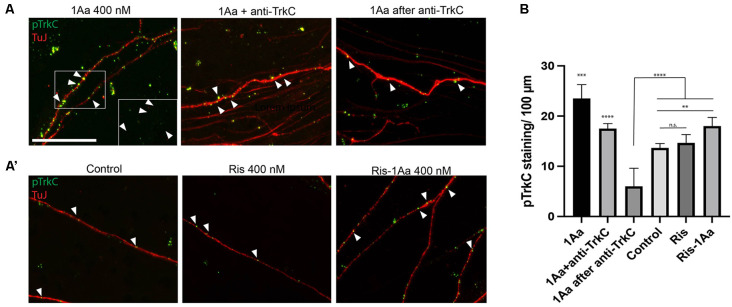
Figure 6.
1Aa and Ris-1Aa activate TrkC in vitro. (A) and (A′) Expression of phosphorylated TrkC (pTrkC) on SGN neurites in vitro. Neurites were stained with neuronal marker TuJ (red), and phosphorylated TrkC (green), and nuclei were labeled with DAPI (blue). Scale bar represents 10 μm. The outgrowth of 1Aa was compared to pre-treatment with a blocking anti-TrkC antibody (1Aa after anti-TrkC) or simultaneous treatment with 1Aa and anti-TrkC (1Aa + TrkC). (A′) pTrkC staining for control, Ris or Ris-1Aa of the same experiment. Images are one representative experiment of three independently performed experiments. Inlay and arrowheads in (A) and (B) mark examples of pTrkC staining. (B) Quantification of pTrkC per 100 μm. 1Aa and 1Aa+anti-TrkC were each significant compared to all other conditions (**represents p ≤ 0.01, *** represents p ≤ 0.001, **** represents p ≤ 0.0001; n.s., not significant).

