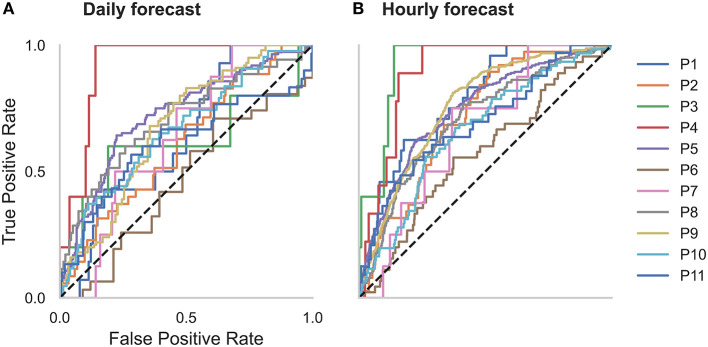
Figure 2.
Receiver operator characteristic (ROC) curves for all participants in the (A) daily and (B) hourly forecast (retrospective testing cohort). The dashed diagonal line represents a balanced random forecast. ROC curves show that hourly forecasts consistently outperformed a balanced random forecaster, and daily forecasts mostly outperformed a balanced random forecaster. Patient-specific forecast performance was assessed by comparing the forecaster's area under the ROC curve (AUC) to the AUC of a rate-matched random forecast (different to the balanced random forecast shown above).

