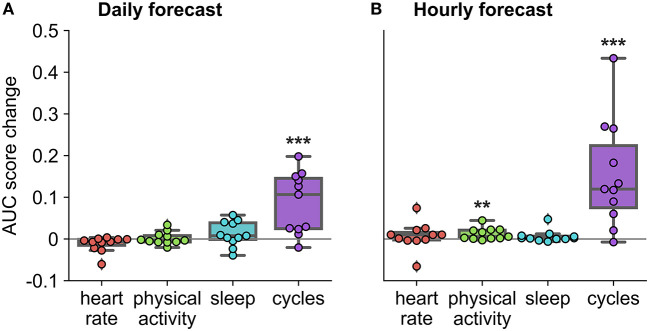
Figure 6.
Auxiliary contribution of each feature group on forecasting performance in the retrospective testing cohort. AUC score change represents average change computed over ten runs of the algorithm. Performance of each feature group was characterized by comparing the AUC score of the forecasting algorithm once the feature group was added to the AUC score of the forecasting algorithm without the feature group. For example, in the case of physical activity, we compared the AUC score when the algorithm included all feature groups to the AUC score when the algorithm included only heart rate, sleep, and cycles feature groups. *Indicates that the feature group's contribution was significantly greater than zero across the cohort, using a one-sided t-test (***p < 0.001 and **p < 0.01). (A) Daily forecast. (B) Hourly forecast.

