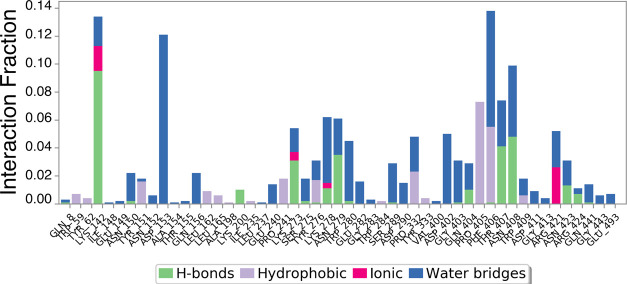
Figure 12.
Bar diagram of α-amylase protein contacts with (Z)-octadec-9-enoic acid showing the specific AAs involved in fluctuations and interactions. The X-axis shows the AA residue number of the α-amylase protein. Protein interactions with the ligand were monitored throughout the simulation. These interactions were categorized by type and are summarized in the plot above. α-Amylase protein–(Z)-octadec-9-enoic acid interactions (or contacts) were categorized into four types: hydrogen bonds, hydrophobic interactions, ionic interactions, and water bridges. The stacked bar charts were normalized over the course of the trajectory: for example, a value of 0.7 indicates that the specific interaction was maintained for 70% of the simulation time.

