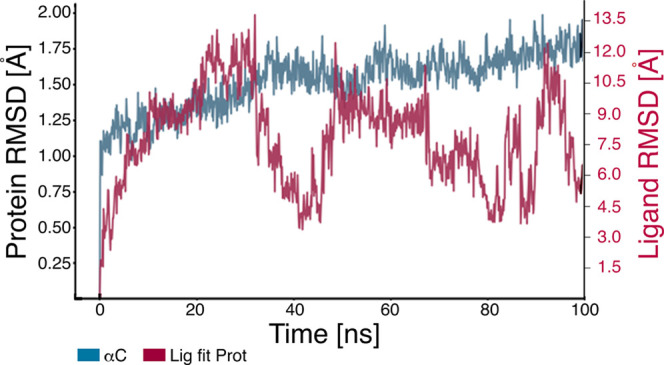
Figure 7.

RMSD plot of α-amylase protein with hexadecanoic acid. The plot shows the RMSD evolution of α-amylase (left Y-axis). The ligand RMSD (right Y-axis) indicates the stability of the ligand hexadecanoic acid with respect to α-amylase and its binding pocket. In the plot, “Lig fit Prot” shows the RMSD of hexadecanoic acid when the α-amylase–hexadecanoic acid complex is aligned to the protein backbone of the reference, followed by measurement of the RMSD of hexadecanoic acid heavy atoms. Values significantly larger than the RMSD of α-amylase indicate that hexadecanoic acid diffused from its initial binding site. Good binding was observed at 40 ns and after 80 ns.
