Figure 9.

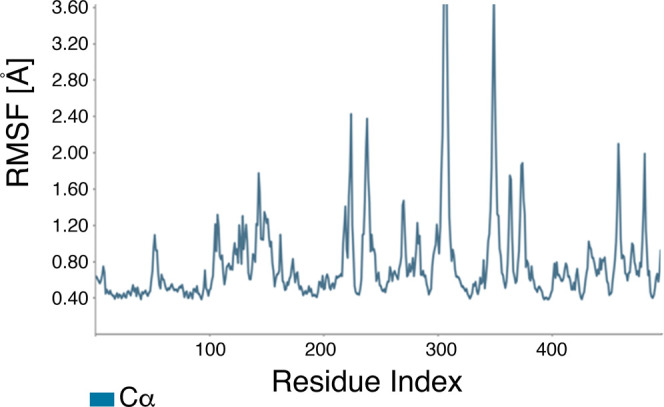
RMSF plot of the α-amylase protein with hexadecanoic acid. The X-axis shows the AA residue number of the α-amylase protein. On this plot, peaks indicate areas of α-amylase that fluctuated most during the simulation.

RMSF plot of the α-amylase protein with hexadecanoic acid. The X-axis shows the AA residue number of the α-amylase protein. On this plot, peaks indicate areas of α-amylase that fluctuated most during the simulation.