Figure 1.

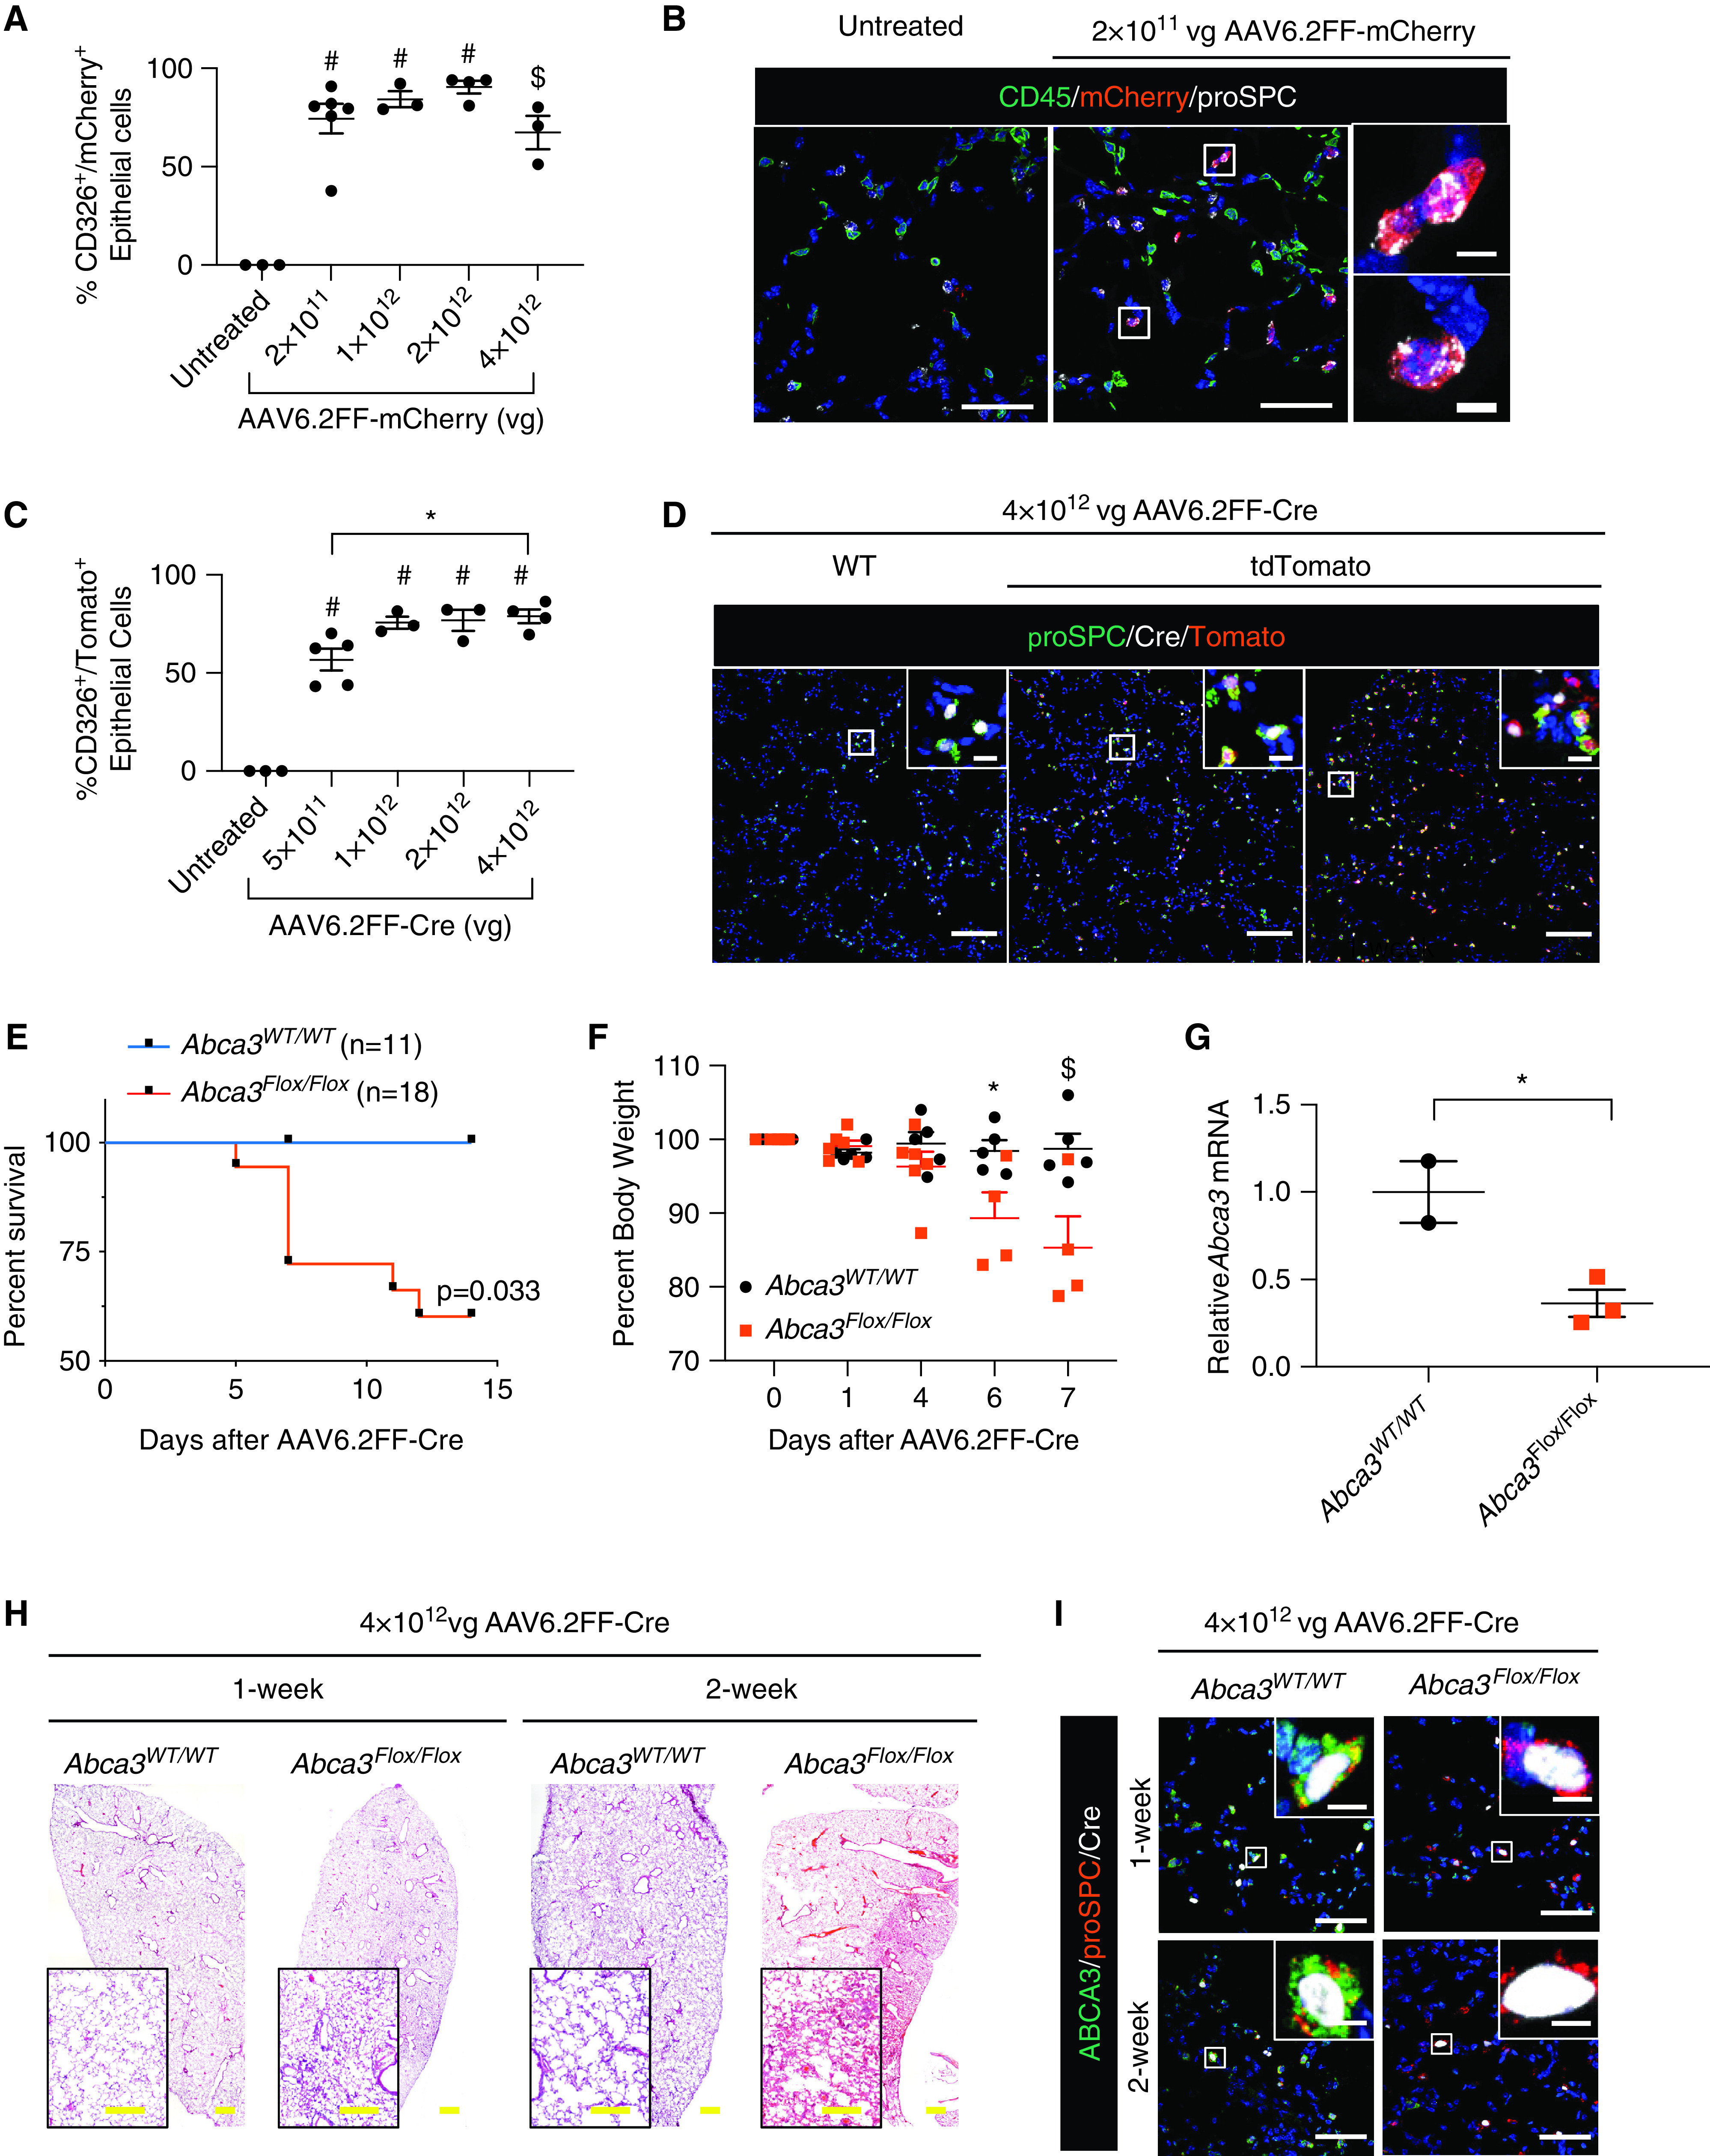
AAV6.2FF transduction of pulmonary epithelial cells. (A and B) C57Bl/6 mice were administered 2 × 10¹¹ – 4 × 10¹² viral genomes (vg) of AAV6.2FF-mCherry intranasally, and mCherry expression was analyzed in whole lungs 2 weeks later by flow cytometry identifying CD326+ epithelial cells (A) and confocal immunofluorescence staining (B) for CD45 (green), mCherry (red), and proSPC (white). Data are expressed as mean ± SE; n = 3–6 mice/group. $P < 0.001 and #P < 0.0001 as determined by one-way ANOVA. (C and D) Gt(ROSA)26Sortm14(CAG-tdTomato)Hze (tdTomato) mice were administered 5 × 10¹¹ – 4 × 10¹² vg AAV6.2FF-Cre intranasally, and expression of tdTomato was analyzed in whole lungs 2 weeks later by flow cytometry identifying CD326+ epithelial cells (C) and confocal immunofluorescence staining (D) for proSPC (green), tdTomato (red), and Cre (white). Data are expressed as mean ± SE; n = 3–5 mice/group. *P < 0.05, and #P < 0.0001 as determined by one-way ANOVA. (E–I) Abca3WT/WT or Abca3Flox/Flox mice were administered 4 × 10¹² vg of AAV6.2FF-Cre intranasally, and lungs were analyzed histologically 1 and 2 weeks later. (E) Kaplan-Meier curve for survival and statistical analysis (Wilcoxon-Gehan test). (F) Percentage body weight after AAV6.2FF-Cre administration. Data are expressed as mean ± SE; n = 4–5 mice/group. *P < 0.05 and $P < 0.001 as determined by one-way ANOVA. (G) Quantitative PCR of Abca3 mRNA in whole lung at 1 week after transduction. Data are expressed as mean ± SE; n = 2–6 mice/group. *P < 0.05 as determined by unpaired Student’s t test. (H) Representative lung histology is shown. (I) Representative confocal immunofluorescence staining for ABCA3 (green), proSPC (red), and Cre (white). Scale bars: A and I, 50 μm; insert scale bars, 5 μm; D, 100 μm; insert scale bars, 10 μm; H, 500 μm; insert scale bar, 250 μm.
