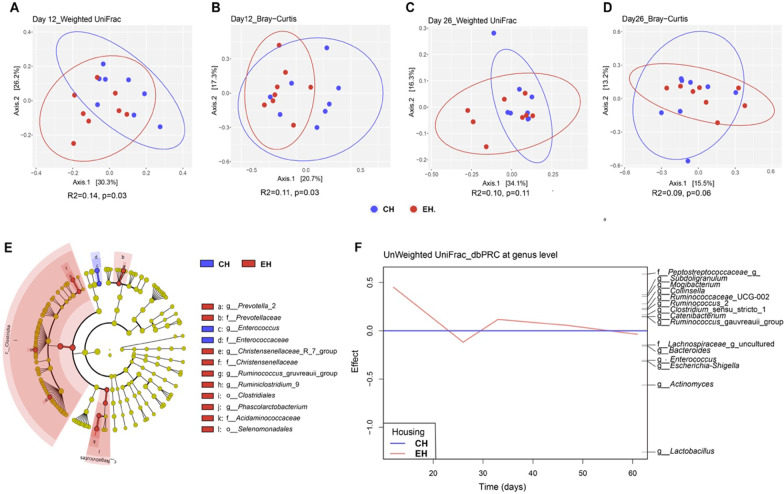
Fig. 4.
The effect of housing condition on microbiota colonization. Principal coordinate analysis (PCoA) plots based on pairwise weighted UniFrac distance and Bray–Curtis dissimilarity matrices using data from day 12 (A, B) and day 26 (C, D) at amplicon sequence variant (ASV)-level. Significance of the difference between conventional housing (CH) and enriched housing (EH) was assessed using PERMANOVA. E Cladogram of taxa differentially abundant between CH and EH pigs on day12 according to LEfSe. The color indicates the difference between both housing types in which the taxa were more abundant and the radius of each shaded sector is corresponding to the relative abundance. F Unweighted UniFrac based principal response curve (dbPRC) summarizing the multivariate response of EH versus CH at genus level over time. Genera with large deviations between CH and EH have high effect while taxa equally present in CH and EH have zero effect

