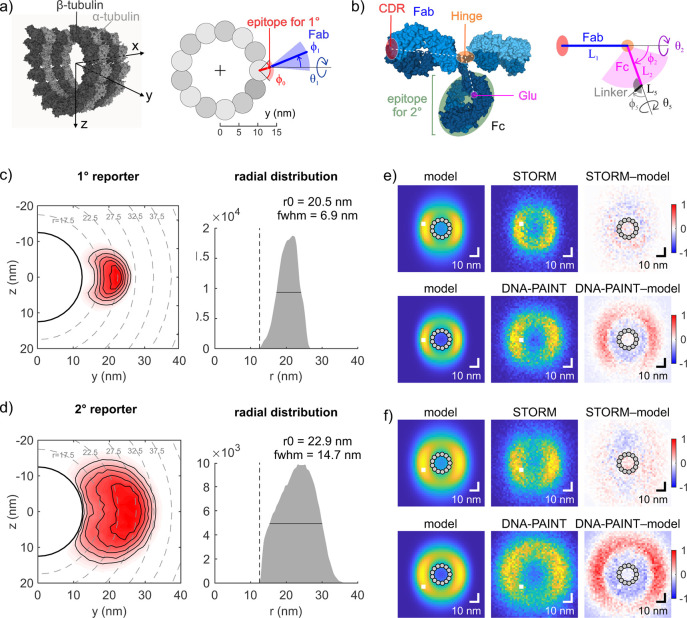
Figure 3.
Monte Carlo simulations of antibody conformations at microtubules. (a) Location of the epitope of the anti-α-tubulin antibody in our geometric model (right) based on the cryo-EM structure of a microtubule (left; PDB 5SYF, ref (27); molecular surface rendered using Mol*, ref (33)). (b) Each IgG molecule was modeled by two segments corresponding to Fab and Fc fragments connected by a flexible hinge region. Right: Parametrization of Fab, Fc, and linker segments of the labeled primary antibody. Left: Dimensions were based on the crystallographic structure of IgG2a (PDB 1IGT, ref (30), visualization by Mol*). While the location of the modification is precisely known (Glu), the binding sites of polyclonal secondary antibodies are assumed to be evenly distributed over the Fc region. For a schematic of indirect immunolabeling, see Supplementary Figure S5c). Simulated reporter distribution for primary antibodies. Left: yz cross-section. Right: Radial distribution. (d) Simulated reporter distribution for primary plus secondary antibody complexes. Panels as in (c). (e) Comparison of reporter distributions for primary antibodies between simulations (left; convolved with the localization and experimental imprecision) and experiments (middle: pooled cross-sections as in Figure 2). Right: Normalized residuals of the difference between experiment and model. Top: STORM. Bottom: DNA-PAINT. (f) Comparison of reporter distributions for secondary antibodies between simulations and experiments. Panels as in (d).

