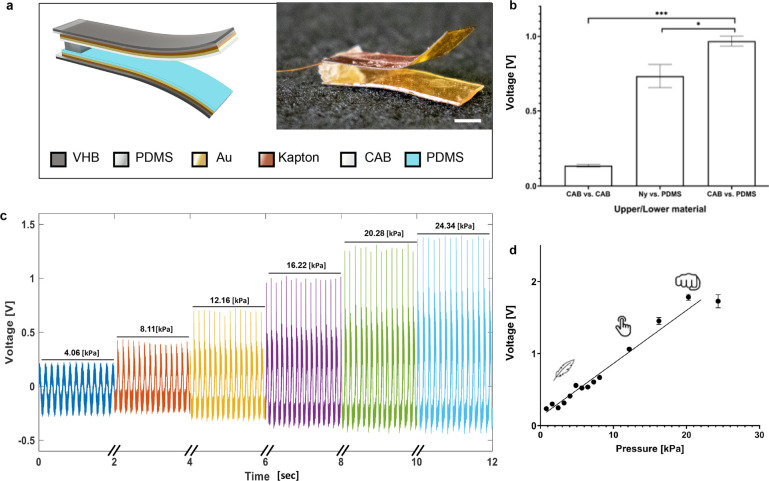
Figure 2.
TENG-IT characterization. a. Schematic of the TENG-IT layers (left) and a photo of the TENG-IT (right) (scale bar: 2 mm). b. Mean peak-to-peak electrical output modulation of TENG-IT (5 mm × 5 mm), as a function of the materials used for the friction layers. c. Output performance of TENG-IT (5 mm × 5 mm) for different levels of pressure applied. d. TENG-IT (5 mm × 5 mm) response to physiological pressure. We observe a linear correlation (R2 = 0.97) between the average peak-to-peak output voltage and pressure applied to the device.

