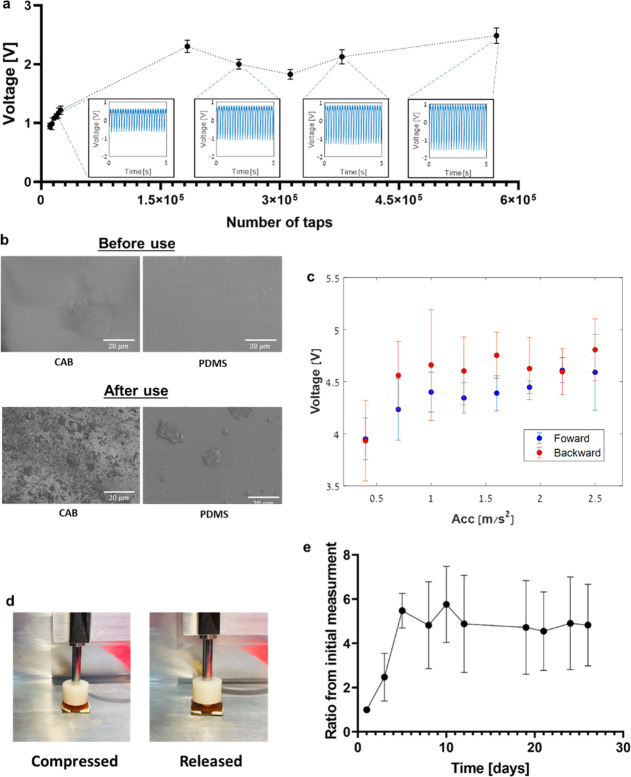
Figure 3.
a. Average peak-to-peak output voltage from TENG-IT. Insets in blue show raw data corresponding to 5 s intervals after specific time points. Pressure applied was 15 kPa at 4.5 Hz. b. SEM images of the TENG-IT (5 mm × 5 mm): top view of each layer of dielectric material (CAB or PDMS). The roughness of the surface of the dielectric materials changes for both PDMS and CAB, after >0.5 million taps of 15 kPa. c. Average peak-to-peak output voltage of the TENG-IT in response to a set of increasing and decreasing accelerations (pressures) (labeled “forward” for increasing pressures [blue] and “backward” for decreasing pressures [red] that immediately followed; n = 3). d. Example of TENG-IT compression. e. Average peak-to-peak output voltage divided by the initial peak-to-peak measurement (n = 3). The pressure was applied by a motor moving in a sinusoidal motion at 1 Hz at peak acceleration of 3.95 m/s2.

