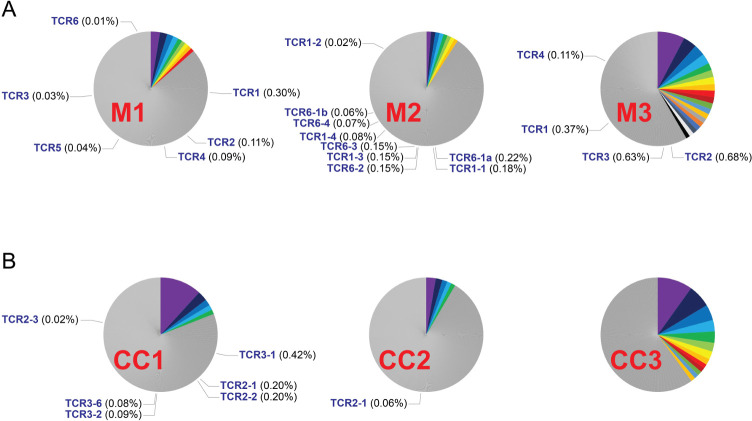
Figure 5.
The frequencies of identified neoantigen-specific TCR clonotypes. Single-cell data generated from each tumor specimen were merged and analyzed. (A) The results of clonotype analysis for melanoma specimens are shown. (B) The results of clonotype analyses for colorectal cancer specimens are shown. TCR clonotypes with relatively high frequencies (>1%) were labeled with colors. TCR clonotypes that were only detected once were removed from the frequency calculation. The identified neoantigen-specific TCR clonotypes and their frequencies were indicated in each pie chart. Notably, the clonotypes of CC2 unique TCR2-2 and CC3 unique TCR2-2 were only detected once, and their frequencies were not calculated. TCRs, T-cell receptors

