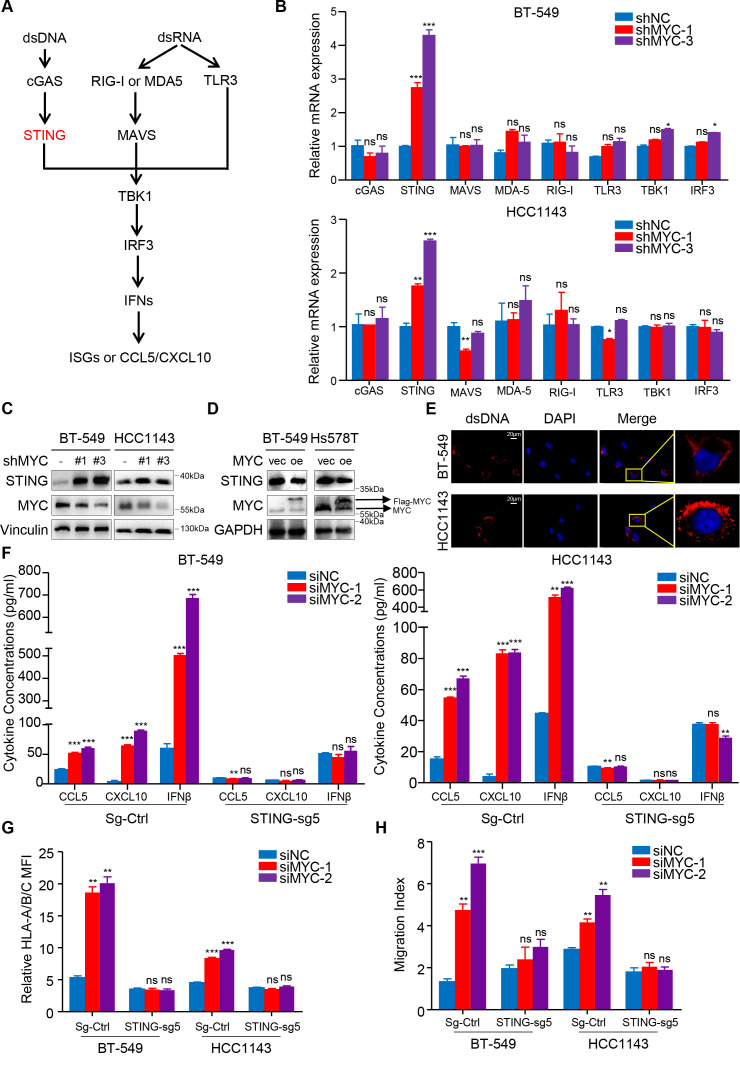
Figure 4.
MYC represses type I interferon signaling by modulating STING expression. (A) Schematic of the pattern recognition receptor pathways. (B) RT-qPCR analyses of genes related to these pathways in BT-549 and HCC1143 cells with MYC knockdown. (C, D) Immunoblotting analyses of STING expression in BT-549 and Hs578T cells with MYC knockdown (C) or MYC overexpression (D). (E) dsDNA and DAPI staining in BT-549 and HCC1143 cells using immunofluorescence. (F, G) Change in CCL5, CXCL10 and IFNβ levels measured by ELISA (F), flow cytometry analyses of MHC-I expression (G) in BT-549 and HCC1143 cells transfected with MYC-siRNAs or NC-siRNA in the negative control and STING-knockdown groups. (H) Migratory ability of in CD8+ T cell cocultured with BT-549 and HCC1143 cells transfected with MYC-siRNAs or NC-siRNA in the negative control and STING-knockdown groups. Relative MFI was calculated by dividing MFI in each group by MFI of isotype control. Migration index was calculated by dividing the number of cells that migrated in each group by the number migrating in CD8+/media alone group. The data are presented as the mean±SEM (B, F–H); n=3 independent experiments (B, F–H); two-tailed unpaired Student’s t test (B, F–H). *P<0.05; **P<0.01; ***P<0.001. DAPI, 2-(4-Amidinophenyl)-6-indolecarbamidine; IFNβ, interferon β; MFI, mean fluorescence intensity; NS, not significant; RT-qPCR, quantitaive reverse transcription PCR; SEM, standard error of mean.

