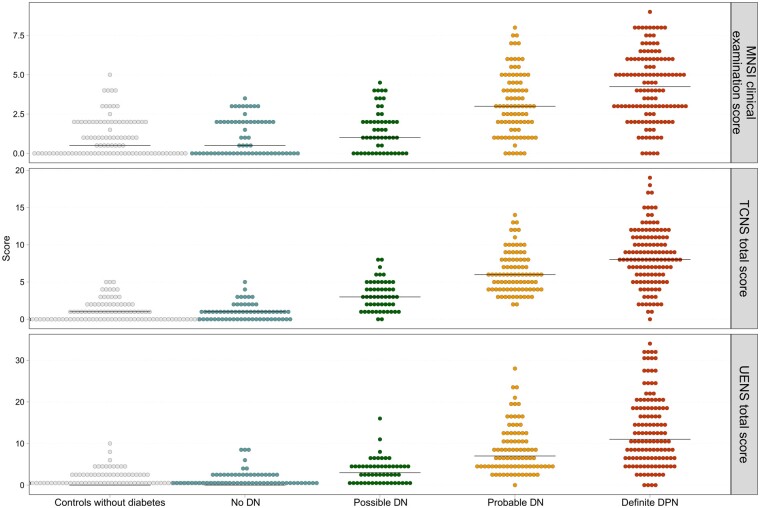
Figure 4.
Correlation of median scores of the MNSI examination part, TCNS and UENS across DN groups, including controls without diabetes, and receiver operating characteristic (ROC) areas. MNSI: rs 0.61, P < 0.001, ROC area: 0.71; Toronto Clinical Neuropathy Score (TCNS): rs 0.79, P < 0.001, ROC area: 0.69; Utah Early Neuropathy Scale (UENS): rs 0.73, P < 0.001, ROC area: 0.66. Modified from Gylfadottir et al.78

