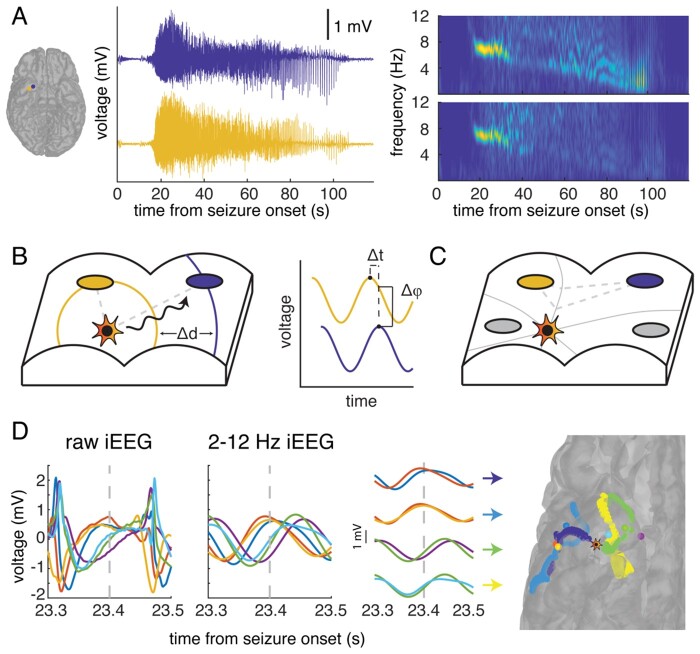
Figure 1.
The source of seizure activity emits travelling waves. (A) In a typical seizure event recorded by two electrodes (blue and yellow) in the inferior temporal lobe in a single participant, the iEEG recording demonstrates an initial period of high-frequency activity that transitions to a characteristic low-frequency, high-amplitude periodic spike-and-wave pattern. A spectrogram of the iEEG recordings in both electrodes (right) demonstrates the emergence of a single dominant frequency band at around 20 s after seizure onset, which reflects the oscillatory nature of the recorded signal. The frequency of this signal progressively decreases with time. (B) We hypothesize that there is a single source of seizure activity (star) that emits travelling waves (black). In a schematic representation of a section of cortex, these waves propagate in a circular manner and are detected by different iEEG electrodes (blue and yellow) at different times. We use the difference in phase of the waves recorded at adjacent electrodes (right) as a surrogate for the difference in time in order to compute the relative difference in distance between the source and each electrode. (C) The relative difference in distance (grey dashed line) between the source and two electrodes, computed using the difference in phases of the recorded oscillatory signal, constrains the location of the source of activity to a point on a hyperbola (grey solid line). With multiple pairs of electrodes, we produce multiple hyperbolae at each time point of seizure activity. We estimate the location of the source (star) as the point that lies closest to the intersection of the hyperbolae. (D) The raw (left) and 2–12 Hz filtered (middle) iEEG signal recorded by six electrodes in the same example participant demonstrates the spike-and-wave morphology and respective phase differences between the electrode signals. The colour of the electrode’s trace is preserved across panels. Using the phase difference over pairs of adjacent electrodes, we may generate hyperbolae on the cortical surface (right, coloured for each pair) that constrain the estimated location of the source of the emitted waves (star) at each single sample, in this case 23.4 s following seizure onset (grey dashed line).

