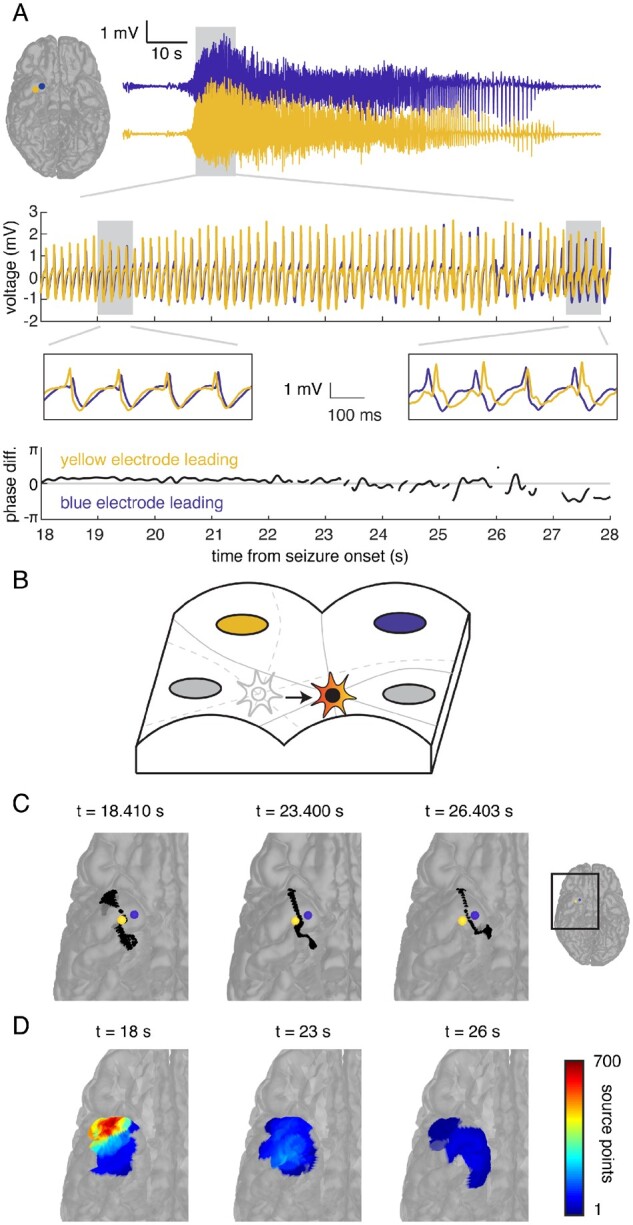
Figure 2.

The estimated location of the source of seizure activity changes with time. (A) A magnified view of 10 s of the iEEG time series data (top, middle insets) recorded by two electrodes demonstrates the phase relationship between the tracings recorded by both electrodes (bottom). Initially, activity in the lateral electrode (yellow) leads activity in the medial electrode (blue, left inset), but this phase relationship reverses around 23 s following the onset of the seizure (right inset). (B) Using the phase difference between the signals recorded in each pair of electrodes generates a hyperbola (grey) for each pair that constrains the estimated location of the source of seizure activity at every time point. If the phase differences change over time, the hyperbolae, and therefore the estimated location of the source, also change, suggesting that the source of the emitted waves is moving (grey to red star). (C) For the two example electrodes, the hyperbola (black) that estimates the location of the source on the reconstructed cortical surface initially curves towards the lateral electrode (yellow), but then curves towards the medial electrode (blue) at a later time point. (D) We aggregated the number of times any location was estimated as the source of the emitted waves into regions of interest during each 1-s epoch. Each region of interest is coloured according to the number of times a point within that region of interest was estimated as the seizure source during that 1-s epoch. Over three epochs, the location most frequently estimated as the seizure source moves from the anterolateral to medial subtemporal cortex.
