Figure 3.
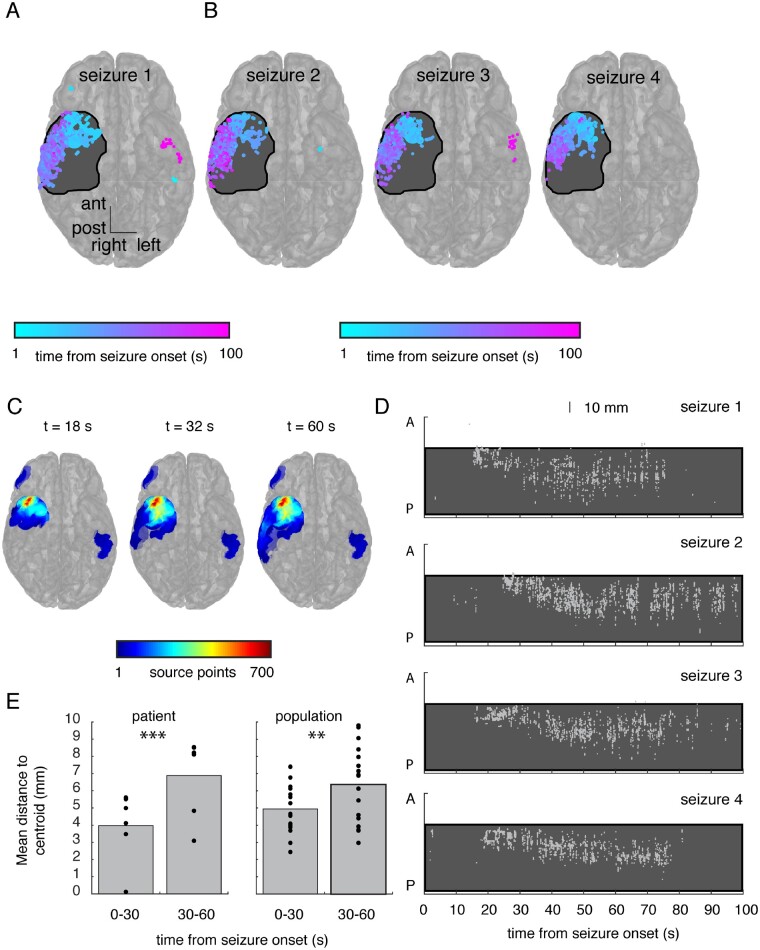
The seizure source moves over long timescales in a stereotyped fashion across seizure events. (A) We visualized all locations that were identified as the estimated source of seizure activity throughout this seizure, colour-coded by the time following seizure onset that each location was identified. The size of each point reflects the number of times each individual location was identified as the seizure source. Locations that were identified multiple times are colour-coded by the mean time of their identification. This participant had a subsequent anterior temporal lobectomy (resection region shaded black). For clarity, we collapsed all points along the superior-inferior axis (right) to demonstrate the location of each point along the anterior-posterior and left-right dimensions. A transparent brain is shown for reference. The source of the emitted waves initially localizes briefly to the left lateral temporal lobe, then to the right temporal tip, the right lateral temporal cortex, and then again to the left lateral temporal cortex at the end of the seizure. (B) Across three additional seizures captured in this participant, the temporal evolution of the seizure source exhibits a similar stereotyped pattern of movement. (C) We aggregated discovered source points into regions of interest accumulated over time up to and including three time points in the seizure. Over the course of the seizure, the estimated location of the source migrates from the right anterior subtemporal cortex to the lateral temporal cortex, but rate of localization in these areas does not exceed the high initial rate of source discovery, which localized to the anterior temporal lobe. (D) The temporal evolution of the location of the estimated seizure source is stereotyped across the four different seizures shown in A and B. Locations are shown in only the anterior-posterior direction and are collapsed across the superior-inferior and left-right directions. Each grey dot represents a single estimated source location at that time. The region that was subsequently resected in this participant is shaded in black. (E) We quantified spatial spread by extracting the mean pairwise distance between estimated source locations during every second of every seizure. We computed the mean spatial spread over the first and second 30 s of each seizure. Across all seizures in this participant, seizure source localization is significantly more diffuse in the second 30 s (P = 0.0004; left; each dot represents a single seizure). We repeated this analysis in every participant and, averaging across participants, we found a similar difference in spatial spread between the first and second 30 s of seizure (P = 0.008; right; each dot represents a single patient).

