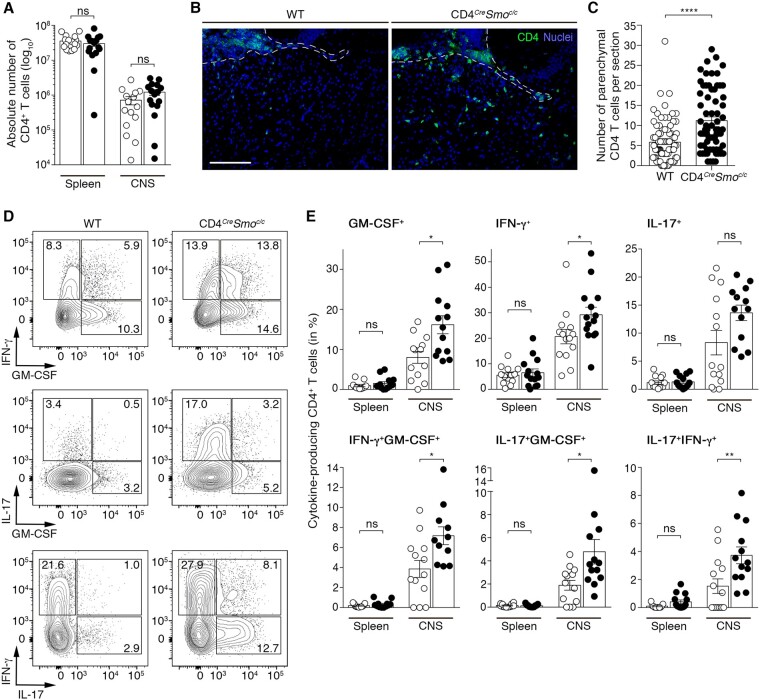
Figure 2.
SHH dampens the pathogenicity of CNS-infiltrating CD4 T cells. (A) Absolute count of CD4+ T lymphocytes in the spleen and CNS of wild-type (WT, open circles) and CD4CreSmoc/c (filled circles) mice at the peak of EAE as assessed by flow cytometry. Data are expressed as means ± SEM and represent n = 6 independent experiments with five animals/group. (B) Immunofluorescent staining for CD4 (green) and nuclei (DAPI, blue) in the brain of CD4CreSmoc/c and wild-type mice at the peak of disease. Dashed lines delineate the meninges bordering the brain parenchyma. Scale bar = 100 μm. (C) Quantification of the number of CD4 cells found within the brain parenchyma of WT and CD4CreSmoc/c mice at the peak of disease. Data are representative of 12 sections taken out of n = 5 wild-type and n = 6 CD4CreSmoc/c animals. (D) Representative flow cytometry plots and (E) percentages of GM-CSF, IFN-γ, IL-17 single or double producing CD4 T cells in the spleen and CNS of wild-type (open circles) and CD4CreSmoc/c (filled circles) mice at the peak of EAE. Data are representative of n = 6 independent experiments with 13–14 animals/group. (A, C and E) Two-tailed Mann-Whitney test. *P ≤ 0.05, **P ≤ 0.01 and ****P ≤ 0.0001.

