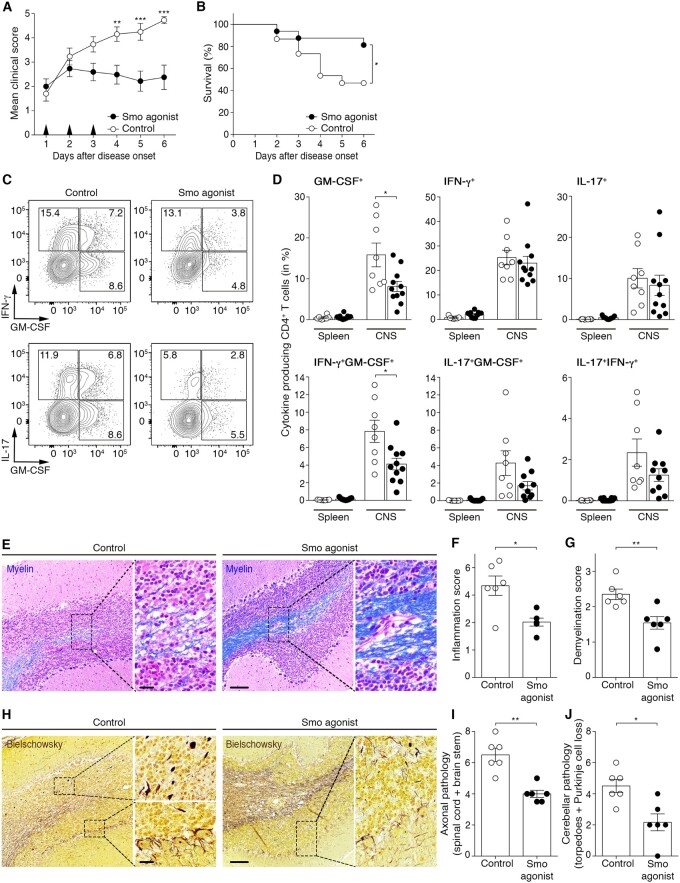
Figure 5.
In vivo therapeutic treatment with an agonist of the Hh pathway alleviates CD4 T cell-driven neuroinflammation. (A) Cumulative clinical EAE score (mean ± SEM) and (B) survival rate of MOG35-55-immunized wild-type (WT) mice treated with vehicle control or SMO agonist for three consecutive days following disease onset. Data shown are from n = 15 controls and n = 16 SMO agonist-treated mice and four independent experiments. (C) Representative flow cytometry plots and (D) percentages of GM-CSF, IFN-γ and IL-17 single and dual-producing CD4 T cells isolated from the spleen and CNS of vehicle control (open circles)- or SMO agonist (filled circles)-treated mice 6 days post-disease onset. Data are from n = 8 controls and n = 11 SMO agonist-treated mice from four independent experiments. (E) Representative images depicting the extent of demyelination [Luxol fast blue/haematoxylin/eosin staining; myelin (blue) and nuclei (purple)] in control- and SMO agonist-treated mice at Day 6 post-disease onset. Scale bar = 100 µm. (F and G) Inflammation and demyelination scores in the CNS of n = 6 controls and n = 6 SMO agonist-treated mice. (H) Representative images showing axonal damage (Bielschowsky’s silver staining) in the brain of vehicle control- or SMO agonist-treated mice 6 days after EAE onset. Scale bars = 20 µm and 100 µm. (I) Axonal pathology score in the brainstem and spinal cord and (J) in the cerebellum of n = 6 controls and n = 6 SMO agonist-treated mice. (A) Two-way ANOVA with Sidak’s correction for multiple comparisons. (B) Kaplan-Meier curves were compared using the Log-rank test. (D, F, G, I and J) Mann-Whitney test was used for comparisons. *P ≤ 0.05, **P ≤ 0.01 and ***P ≤ 0.001.

