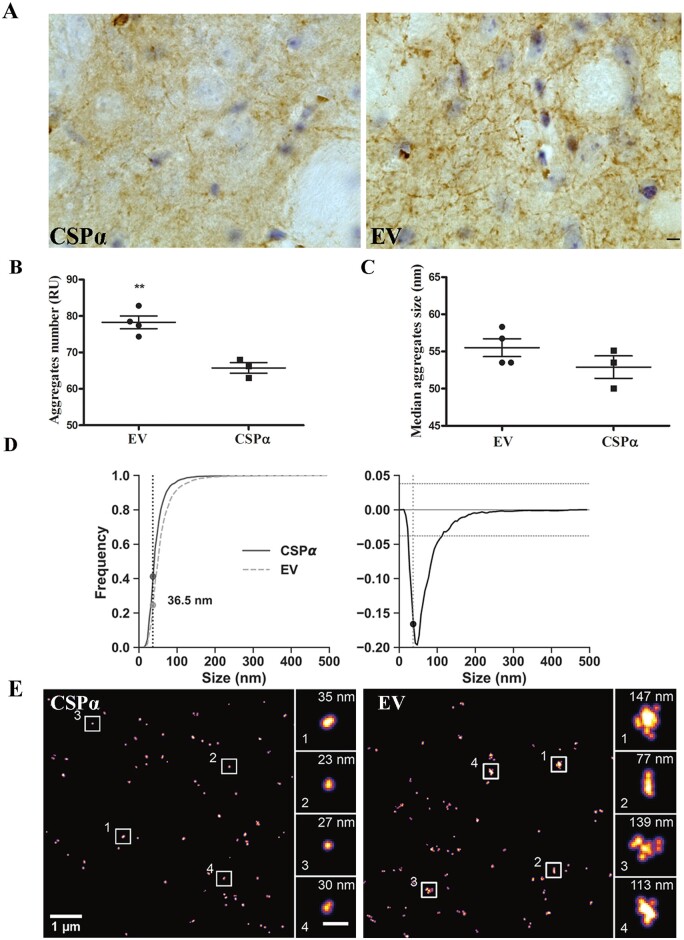
Figure 4.
CSPα reduces α-syn aggregates and increases α-syn monomers in the striatum of 1-120hαSyn mice. (A) α-Syn immunostaining in the striata of CSPα and EV treated 1-120hαSyn mice. Scale bar = 10 µm. (B) Aggregate number (RU) versus monomeric α-syn in AAVEV (EV) and AAVCSPα (CSPα)-treated mice based on dSTORM analysis using anti-α-syn Syn1 antibody. A significant reduction in the number of aggregates versus monomeric α-syn is present after AAVCSPα injection. Two-tailed Student’s t-test **P⩽ ≤ 0.01; n = 4 mice per group. (C) Median size of α-syn aggregates showing no significant difference between EV-and CSPα-injected mice. Two-tailed Student’s t-test P > 0.01, n = 4 mice. (D) Cumulative histograms for α-syn species distribution in EV and CSPα-treated mice (left) and difference between the two distributions (right). Frequency values of α-syn species at the 36.5 nm intercept; <36.5 nm, EV 0.245, CSPα 0.411; >36.5 nm EV 0.754, CSPα 0.588. Kolmogorov-Smirnov test **P < 0.01, number of measured species EV: 4583, CSPα: 2574. (E) Representative dSTORM images of α-syn staining in CSPα or EV injected 1-120hαSyn mouse striatum. Note the difference in size of α-syn aggregates (single α-syn aggregates enlarged in boxed areas; scale bar insets = 200 nm).

