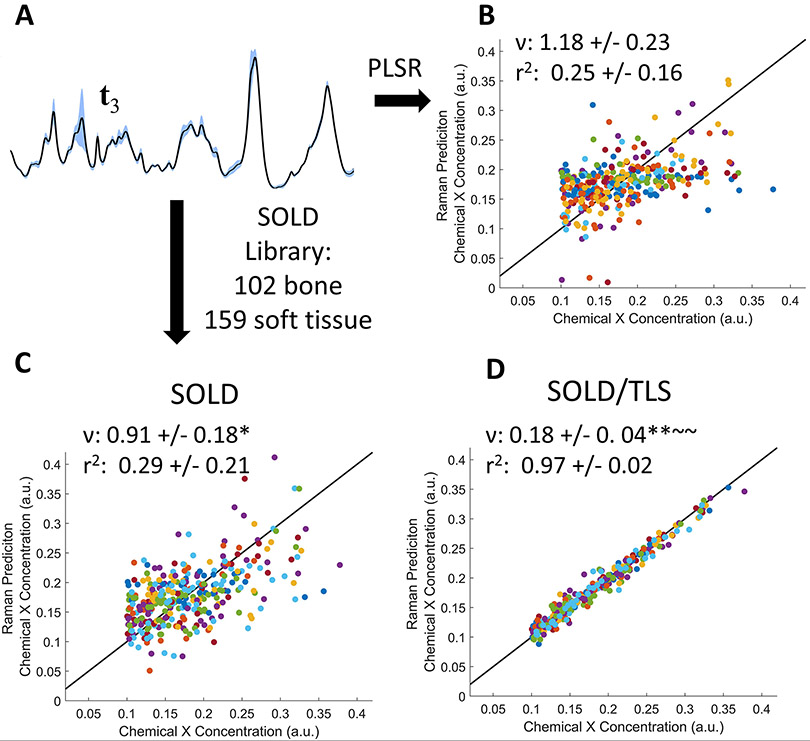
FIGURE 6.
PLSR prediction of simulated trace chemical X concentration using a higher level of soft tissue amplitude variation. (A): Representative set of 33 spectra, showing a less pronounced phosphate peak due to the larger relative amount of soft tissue. (B–D) PLSR predictions using (B) t3, (C) , and (D) tls spectra. ν and r2 are represented as mean +/− standard deviation.
*(p<0.05),**(p<.0001): indicates significance compared to t3 determined by Tukey-Kramer HSD multiple comparisons
~ (p<0.05),~ ~ (p<.0001): indicates significance compared to determined by Tukey-Kramer HSD multiple comparisons

