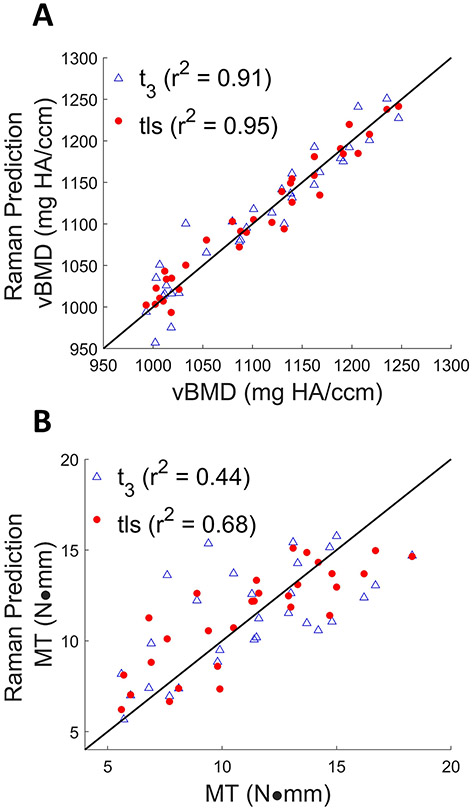
FIGURE 7.
Cross-validation results of vBMD (A) measured by μCT using t3 (marked in blue triangles) (RMSECV = 23.4 mg HA/ccm, r2 = 0.91), and tls spectra (marked in red circles) (RMSECV = 17.0 mg HA/ccm, r2 = 0.95). Cross validation results of MT (B) measured by torsion testing using t3(RMSECV = 2.64 N·mm, r2 = 0.44), tls spectra (RMSECV = 1.97 N·mm, r2 = 0.68). The line of perfect prediction is provided as a guide to the eye; it is not a fit.

