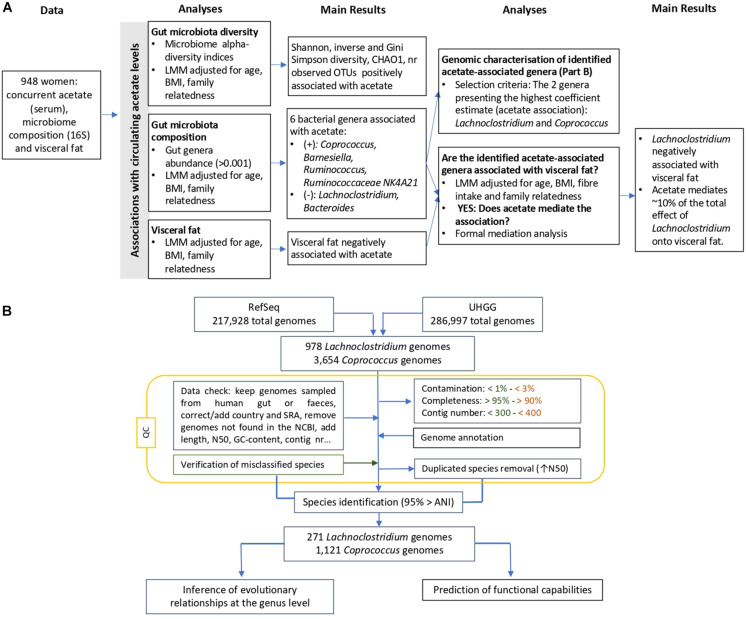
FIGURE 1.
Overview of the flowchart (A) integrating gut microbiota composition and diversity, visceral fat and circulating acetate levels, and (B) showing the applied filters and conducted steps to genomically characterize the Lachnoclostridium spp. and Coprococcus spp. Steps exclusively applied for Lachnoclostridium and Coprococcus are indicated in orange and green, respectively, whereas the rest of steps were conducted in the genomes from both species. ANI, average nucleotide identity; LMM, linear mixed model; UHGG, Unified Human Gastrointestinal Genome; QC, quality control.

