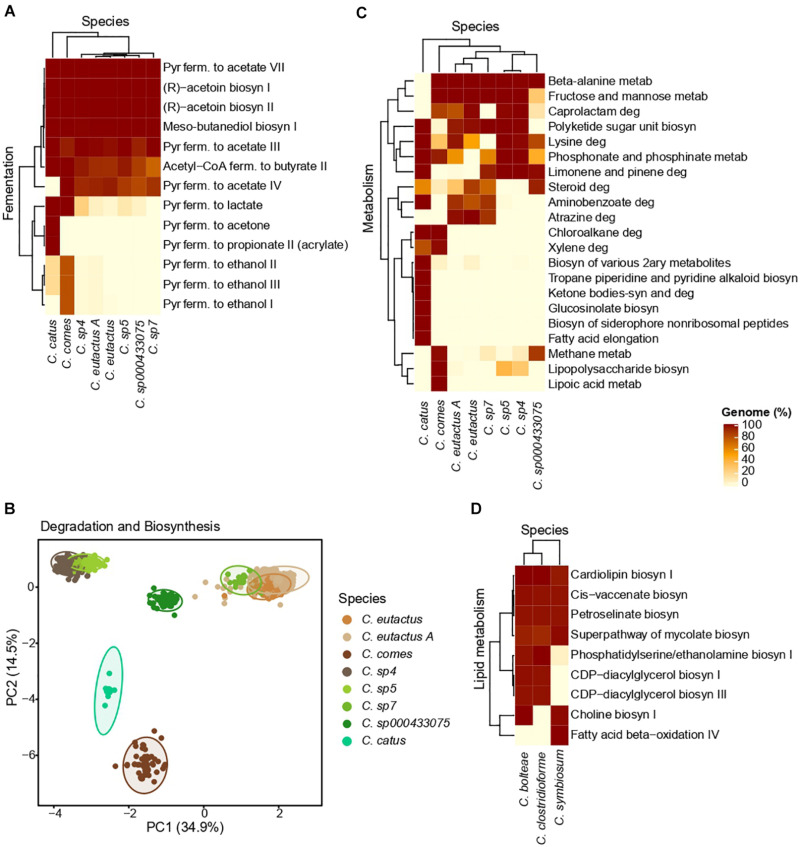
FIGURE 5.
MetaCyc and KEGG results obtained for Coprococcus spp (A–C) and Lachnoclostridium spp (D). (A) Heatmap of the MetaCyc fermentative pathways. (B) PCA clustering based on the MetaCyc data related to the biosynthesis and degradation processes of each species. (C) Heatmap of the KEGG metabolic pathways. Only the pathways highly differential (for a given pathway, at least one species has an abundance value <5% and another species has a value >80%) between species are shown. (D) Heatmap of the MetaCyc pathways related to lipid metabolism in the three major species of Lachnoclostridium (species with >15 genomes). Of note, the shown Clostridium species belong to Lachnoclostridium (Yutin and Galperin, 2013). For all the heatmaps, the pathways and species are hierarchically clustered, and color intensities represent the percentage of genomes of a given species with a specific metabolic pathway. Pyr, pyruvate; ferm., fermentation; metab, metabolism; deg, degradation; biosyn, biosynthesis.

