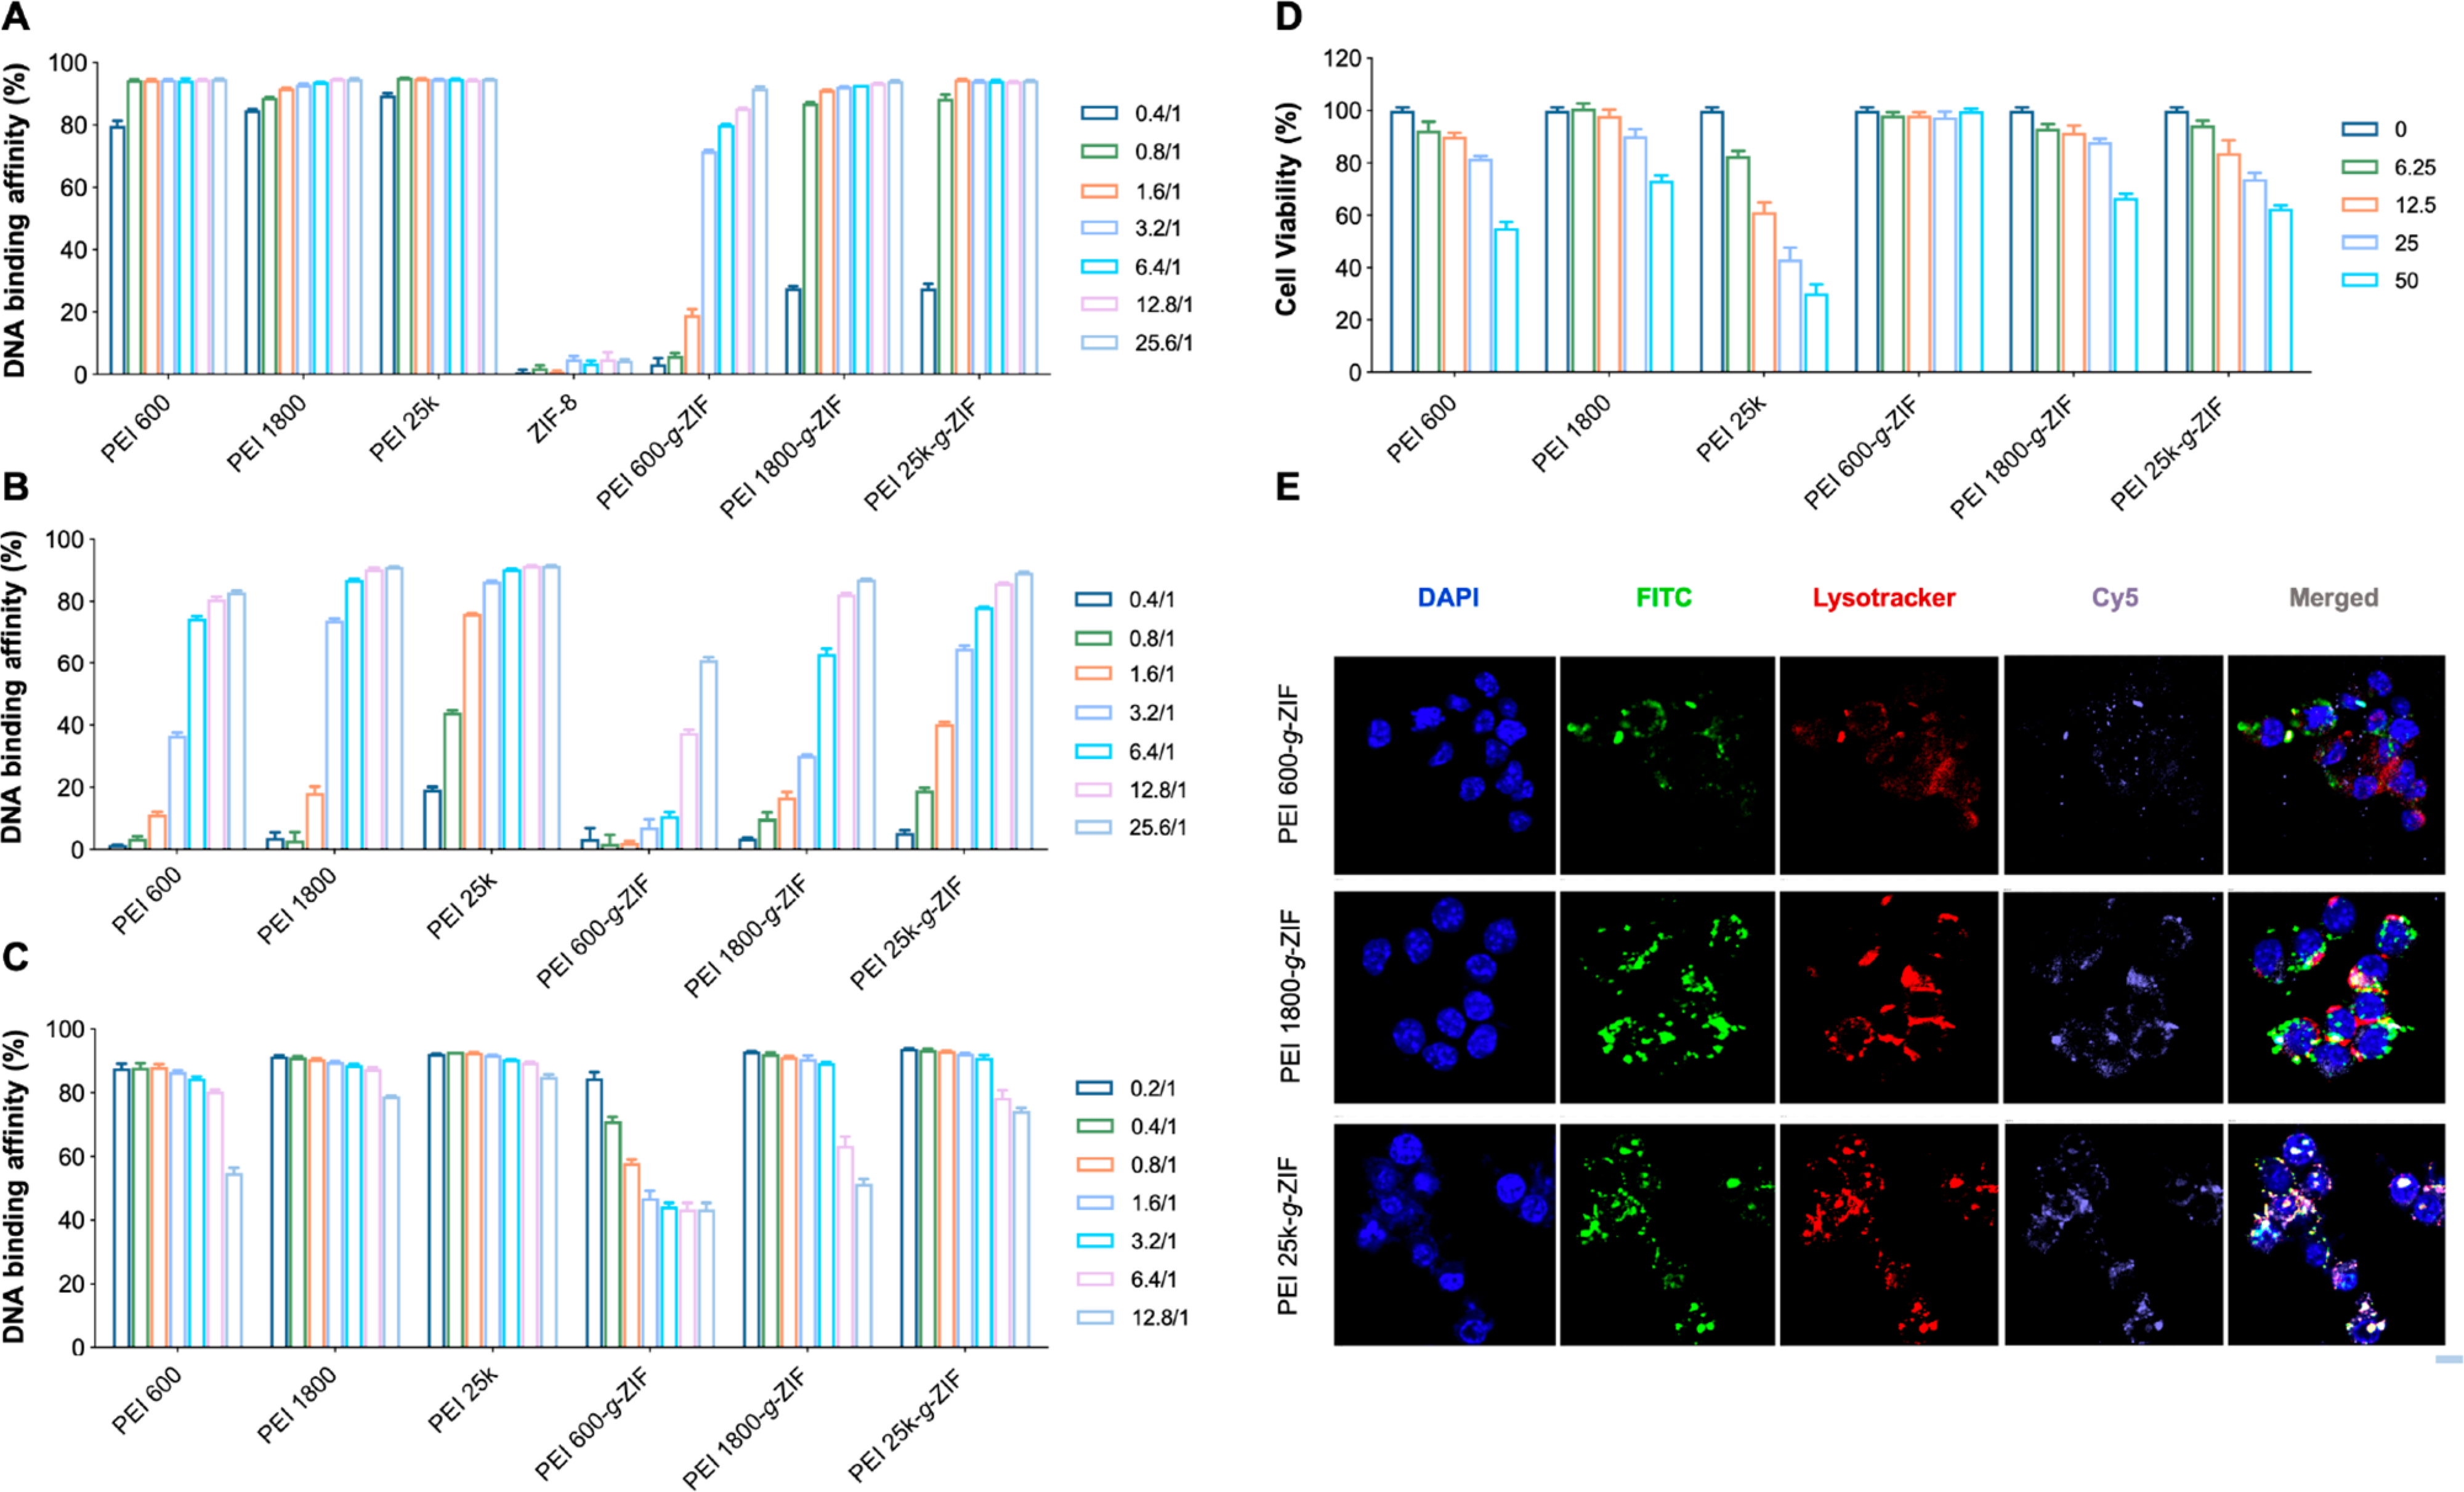
Figure 2.

DNA binding efficiency of pure PEI and PEI-g-ZIF NPs at various NPs:DNA mass ratios at 37 °C in (A) TE buffer and (B) TE buffer with 10% FBS. [DNA] = 0.5 μg/mL. The legends indicate NPs:DNA weight ratios. (C) DNA binding efficiency of different NPs at a weight ratio of NPs to DNA of 12.8/1 in the presence of heparin at different concentrations. [DNA] = 0.5 μg/mL. The legend indicates the heparin:DNA weight ratio. (D) Cytotoxicity of NPs at different concentrations to RAW 264.7 cells. The legend indicates NPs concentration (μg/mL). (E) CLSM images of colocalization of FITC-labeled PEI-g-ZIF NPs and Cy5-labeled CpG in lysosomes. Scale bar, 10 μm.
