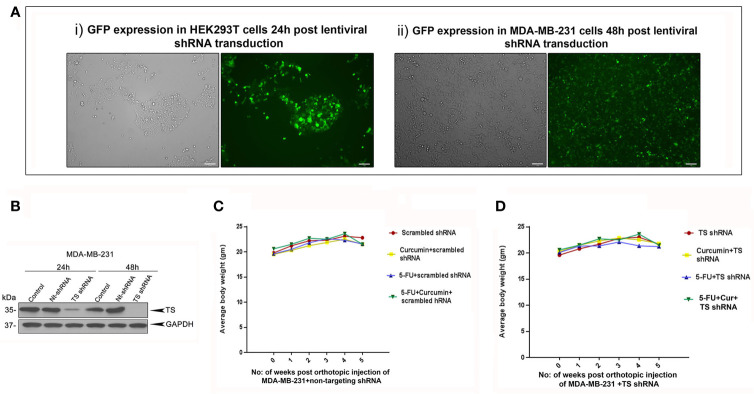
Figure 4.
Analysis of the efficiency of lentiviral transduction and expression status of TS in transduced cells. (A) Efficiency of lentiviral transfection in HEK 293T cells and successive infection in MDA-MB-231 cells, respectively as assessed by GFP expression. (B) Time-dependent analysis of expression status of TS in MDA-MB-231 cells transduced with TS shRNA compared to that of untreated control and cells transduced with control/non-targeting shRNA (Nt-shRNA) using immunoblotting. GAPDH levels are shown as the loading control. (C, D) Comparison of body weight from different treatment groups bearing MDA-MB-231TS xenografts and MDA-MB-231TS- xenografts, respectively.

