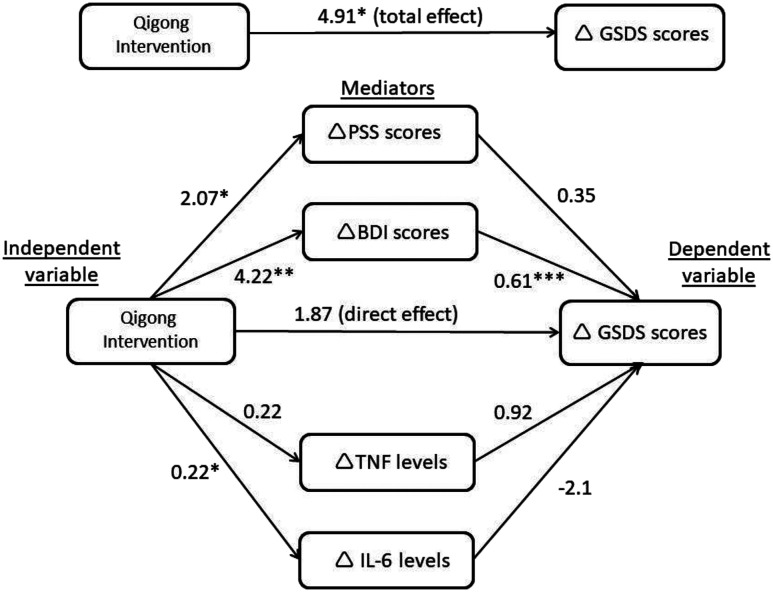
Figure 2. Diagram showing the mediation pathways (n = 169).
*P < .05, **P < .01, ***P < .001. Values on pathways represent unstandardized regression coefficients. Δ Denotes the change from T0 to T2, such that positive numbers indicate decrease in sleep disturbance/stress/depressive symptoms/TNF/IL-6 levels from T0 to T2 (ie, improvement). BDI-II = Beck Depression Inventory, version II, GSDS = General Sleep Disturbance Scale, IL-6 = interleukin 6, PSS = Perceived Stress Scale, TNF = tumor necrosis factor.

