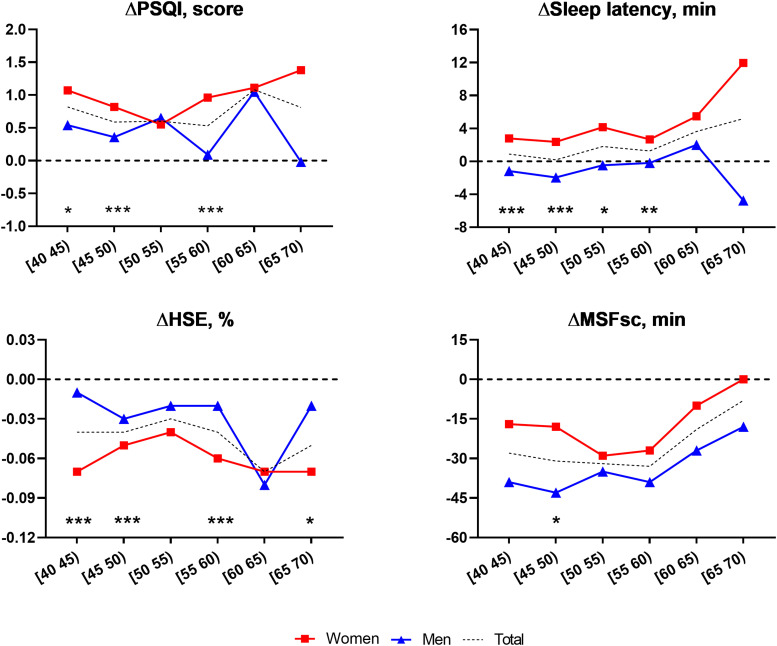
Figure 1. Longitudinal changes in sleep properties between the sexes across age groups.
Dotted lines represent the mean change in sleep properties over the follow-up period in men (blue triangles) and women (red squares) participants by age group. Significant differences between the sexes after adjusting for all covariates are marked by asterisks: *P < .05, **P < .005, and ***P < .001. The black dotted horizontal lines (zero on the y axis) indicate the level that would represent no change. HSE = habitual sleep efficiency, MSFsc = mid-sleep time on free days corrected for sleep debt on weekdays, PSQI = Pittsburgh Sleep Quality Index.

