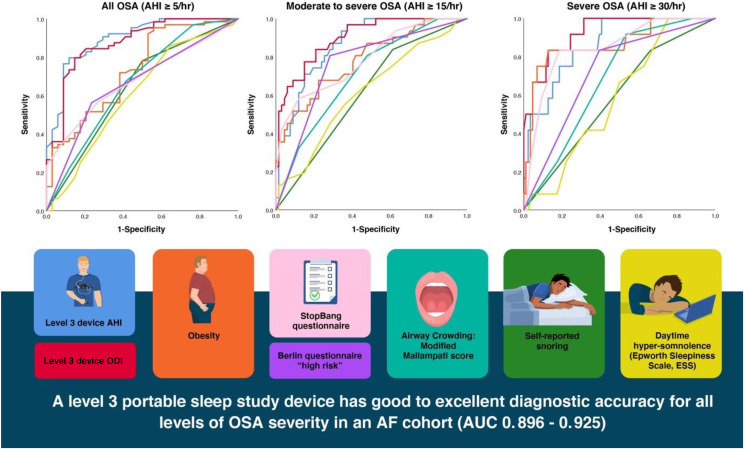
Figure 2. ROC curves depicting the diagnostic accuracy of OSA screening tools at various levels of severity.
A level 3 portable sleep study device had good to excellent diagnostic accuracy for all levels of OSA severity (AUC, 0.896–0.925). For moderate to severe OSA, snoring and self-reported hypersomnolence measured via the ESS both performed with poor diagnostic accuracy. All ROC AUC results are detailed in Table 2. AF = atrial fibrillation, AHI = apnea-hypopnea index, AUC = area under the curve, ESS = Epworth Sleepiness Scale, ODI = oxygen desaturation index, OSA = obstructive sleep apnea, ROC = receiver operating characteristic.

