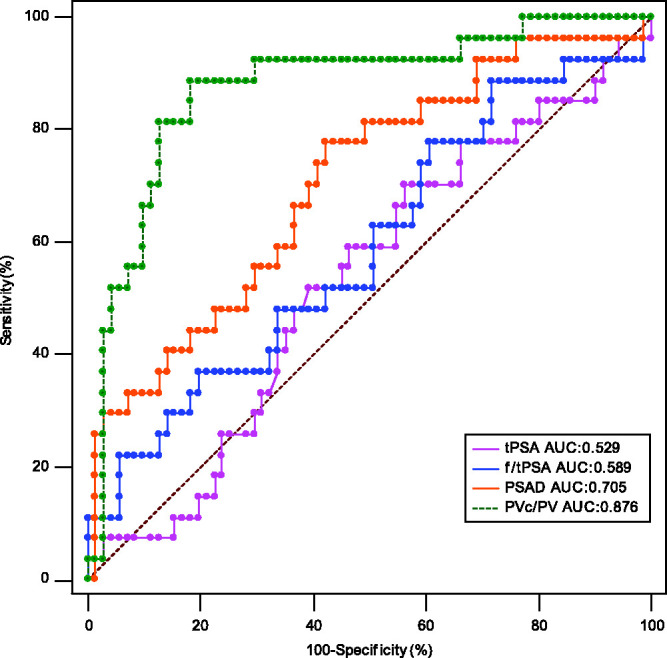
Figure 1.

Receiver operating characteristic (ROC) curve analysis compared the predictive value of the ratio of the central gland volume to total prostate volume (PVc/PV) and other parameters in the diagnosis of all patients with prostate cancer. tPSA, total prostate specific antigen; AUC, area under the curve; f/tPSA, ratio of free to total prostate specific antigen; PSAD, prostate specific antigen density. The colour version of this figure is available at: http://imr.sagepub.com.
