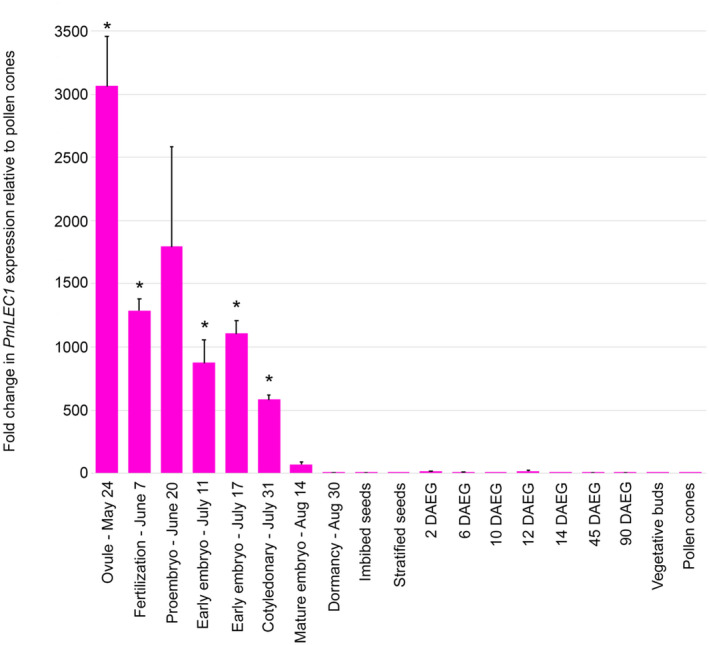
FIGURE 4.

qRT‐PCR analysis of PmLEC1 expression in Douglas‐fir embryonic and vegetative tissues. Total RNA was isolated from 5 biological replicates at each developmental stage. DNase I treatment and reverse transcription were carried out with 5 samples of 1 μg from each stage. The qRT‐PCR reactions were performed in quadruplicate with Douglas‐fir ribosomal L8 transcripts as internal controls. Relative gene expression was calculated according to the 2‐ΔΔCt method (Dorak, 2006) by comparison to transcript levels in pollen cones, which showed the lowest expression. Statistical analysis was performed on the pooled groups by the Mann‐Whitney U test. Results are shown as means ± SE (n = 5). Asterisks indicate PmLEC1 transcript levels that are significantly different (p < .05) from pollen cones. DAEG: days after exposure to germination conditions
