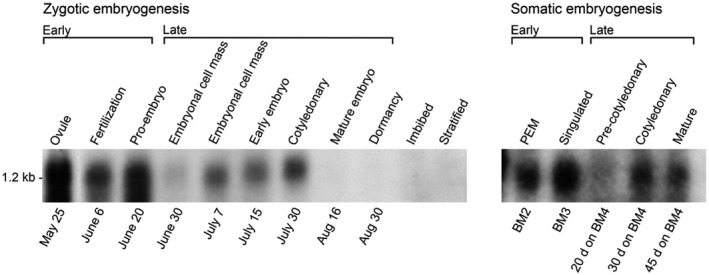
FIGURE 5.

Northern blot analysis of PmLEC1 gene expression demonstrates an alternating pattern of induction and repression during both ZE and SE. Total RNA samples (20 μg each) were resolved by denaturing formaldehyde‐agarose gel electrophoresis, blotted onto nylon membranes and hybridized with 32P‐labeled PmLEC1 cDNA. A single band was visible at approximately 1.2 kb. Labels above the blots indicate the stage of development. Labels below the blots represent dates of seed collection during ZE, and the media and timing for generating somatic embryos during SE. PEM: proembryogenic masses. BM4: culture media in which somatic embryos reach the indicated stage after the specified number of days
