
FIGURE 2.
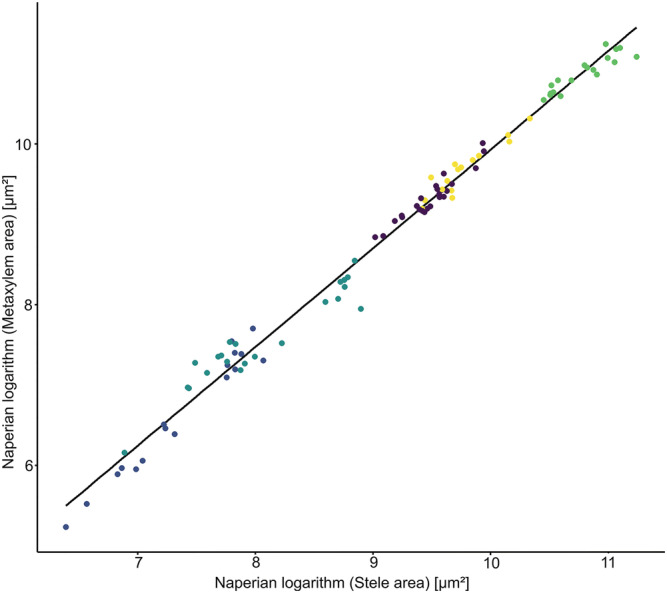
Allometric relationship between the Napierian logarithm of the metaxylem area and the one of the stele area. Data show experimental mean per root cross‐section image. R 2 = .991
Official websites use .gov
A
.gov website belongs to an official
government organization in the United States.
Secure .gov websites use HTTPS
A lock (
) or https:// means you've safely
connected to the .gov website. Share sensitive
information only on official, secure websites.
Allometric relationship between the Napierian logarithm of the metaxylem area and the one of the stele area. Data show experimental mean per root cross‐section image. R 2 = .991