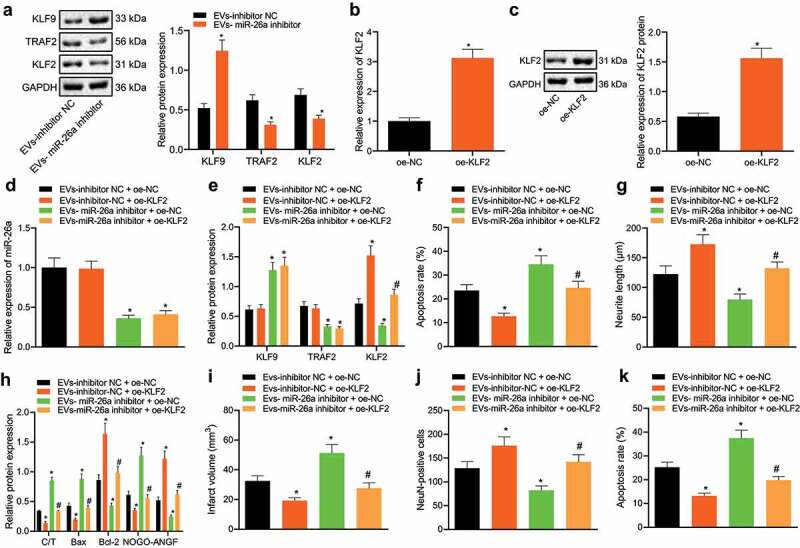
Figure 6.

ASC-EVs miR-26a targeting KLF9 affects TRAF2/KLF2 regulatory axis to prevent neuronal damage
A: The expression of KLF9, TRAF2, and KLF2 as determined by western blot analysis in EVs-inhibitor-NC and EVs-miR-26a inhibitor treated neuronal cells. *, p < 0.05 vs. EVs-inhibitor NC. B: The overexpression efficiency of oe-KLF2 confirmed by qRT-PCR in neuronal cells. C: The overexpression efficiency of oe-KLF2 determined by western blot analysis in neuronal cells. *, p < 0.05, vs. oe-NC treated neuronal cells. D: miR-26a expression as assessed by qRT-PCR in EVs and oe-KLF2 treated neuronal cells simultaneously. E: The expression of KLF9, TRAF2, and KLF2 determined by western blot analysis in neuronal cells treated with EVs-miR-26a inhibitor, oe-KLF2 or both. F: Apoptosis of neuronal cells treated with EVs-miR-26a inhibitor, oe-KLF2 or both examined by flow cytometry. G: The length of neurite outgrowth in neuronal cells treated with EVs-miR-26a inhibitor, oe-KLF2 or both analysed by Motic Images Plus. H: The expression of cleaved caspase-3, caspase-3, Bax, Bcl-2, NOGO-A, and NGF determined by western blot analysis in neuronal cells treated with EVs-miR-26a inhibitor, oe-KLF2 or both. I: Cerebral infarct area stained by TTC in brain tissue slices of mice treated with EVs-miR-26a inhibitor, oe-KLF2 or both. J: Identification of living neuronal cells by NeuN immunofluorescence staining in brain tissue slices of mice treated with EVs-miR-26a inhibitor, oe-KLF2 or both. K: Detection of cellular apoptosis by TUNEL staining in brain tissue slices of mice treated with EVs-miR-26a inhibitor, oe-KLF2 or both. In panels I-K, the dose of miR-26a inhibitor was 200 nM, and miR-26a inhibitor was injected into the mouse lateral ventricle together with the lentivirus expressing oe-KLF2. MCAO surgery was performed 3 days after the injection. After 72 h of reperfusion, the mice were euthanized for analysis. The dose of oe-KLF2 vector was 100 nM, and n = 8 for mice in each group [47]. *, p < 0.05, vs. EVs-inhibitor NC or oe-NC or EVs-inhibitor NC + oe-NC in mouse brain tissue slices, #, p < 0.05, vs. EVs-miR-26a inhibitor + oe-NC in mouse brain tissue slices. The measurement data were expressed as mean ± standard deviation. In panel A, B, C, and D, data were compared by unpaired t-test, in panel E, F, G, H, I, J, and K, data were compared by one-way ANOVA and Tukey’s post hoc test. The experiment was repeated three times independently.
